
Executive Summary
The global financial architecture arrived at its most complex macroeconomic nexus of 2026 on July 2, following the release of the U.S. Bureau of Labor Statistics (BLS) June employment situation report. The headline print delivered an unambiguous shock: the U.S. economy added just 57,000 nonfarm payroll jobs, far below the Dow Jones consensus expectation of 115,000, while the prior two months were revised downward by a combined 74,000. Paradoxically, the headline unemployment rate fell by 0.1 percentage point to 4.2%, masking a massive contraction of 720,000 workers exiting the labor force.
This internally conflicting data release has fundamentally reshaped the mid-year market narrative. Ahead of the print, market pricing heavily favored a strengthening dollar and priced in high probabilities for a September interest rate hike under newly appointed Federal Reserve Chair Kevin Warsh. The soft labor expansion has immediately blunted these hawkish bets, causing the U.S. Dollar Index (DXY) to retreat from long-term trendline resistance while fueling capital rotation into scarce alternative stores of value like gold and Bitcoin. However, because nominal average hourly earnings remained sticky at 3.5% YoY, translating to a negative 0.7% real wage contraction against a 4.2% nominal CPI, Warsh's inflation-first Fed outlook remains locked in a policy box that limits immediate dovish easing.
This institutional report breaks down the mechanical transmission chains, forward macro timelines, structural asset cross-currents, and risk management parameters governing global portfolios in Q3 2026.
What Does June's Weak NFP Report Mean for Global Markets?
The June 2026 employment report has divided major institutional desks, with CNBC’s Jeff Cox labeling the mixed data as fundamentally "ambiguous". While Annex Wealth’s Brian Jacobsen views the soft print as a transition "from a sprint to a jog" rather than a collapse, Vanguard notes it validates their structurally bearish outlook for H2. Vanguard and Glenmede both emphasize that under Chair Kevin Warsh's inflation-first regime, future policy easing will remain strictly dependent on cooling inflation pressures rather than softening labor volumes.
This macro uncertainty continues to reshape asset allocations. Reuters' Paul Hollingsworth highlights that the weak print triggered a "mirror opposite" sell-off in the U.S. dollar and Treasury yields compared to previous strong data trends. Consequently, the J.P. Morgan Mid-Year Outlook stresses that amidst high term premia, gold's strategic value as a core diversification tool is rising significantly.
A rigorous cross-sectional analysis of spot market volumes, futures premiums, and capital flows reveals four distinct asset vectors acting on global order books.
The U.S. Dollar Index (DXY) Stalls at Long-Term Resistance
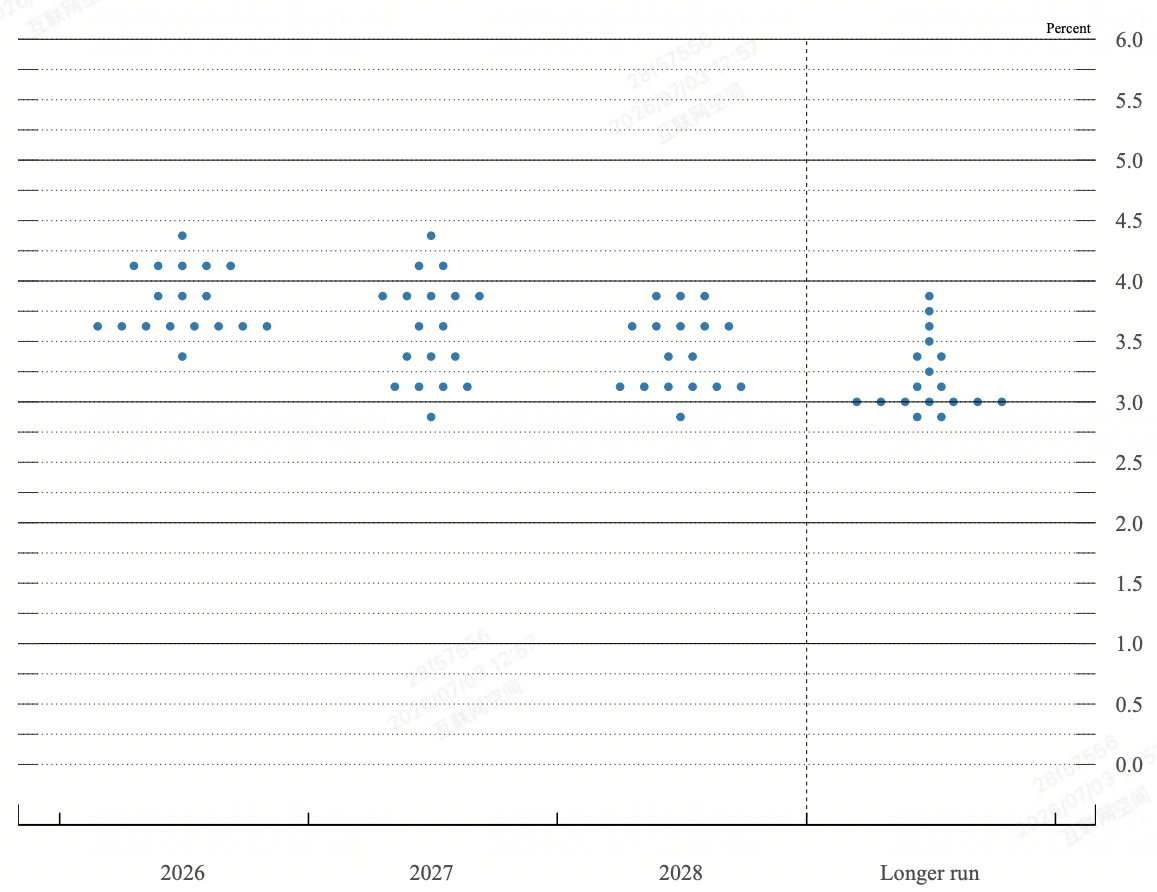
Fed dot plot as of June FOMC | Source: Federal Reserve
The institutional dollar breakout has faced its most severe technical stress test of Q3. Following a robust 4% rally from the May lows fueled by hawkish Fed Dot Plot revisions, the DXY ran directly into long-term downtrend resistance at the 101.14/22 zone. The NFP miss forced a sharp intraday unwinding of long greenback positioning, driving the index down 0.6% to a two-week low of 100.56 before stabilizing near 100.88.
Short-term interest rate futures responded by dropping the implied probability of a July Fed rate hike below 20%. Concurrently, CME FedWatch metrics trimmed the probability of a September rate increase from 75% down to 60%. This structural easing of near-term rate hikes directly drains the marginal interest rate differential advantage from the greenback, leaving the index highly dependent on safe-haven flows from unresolved U.S.–Iran negotiations to defend the psychological 100.00 floor.
Spot Gold Breaks Past Key Resistance Above $4,100
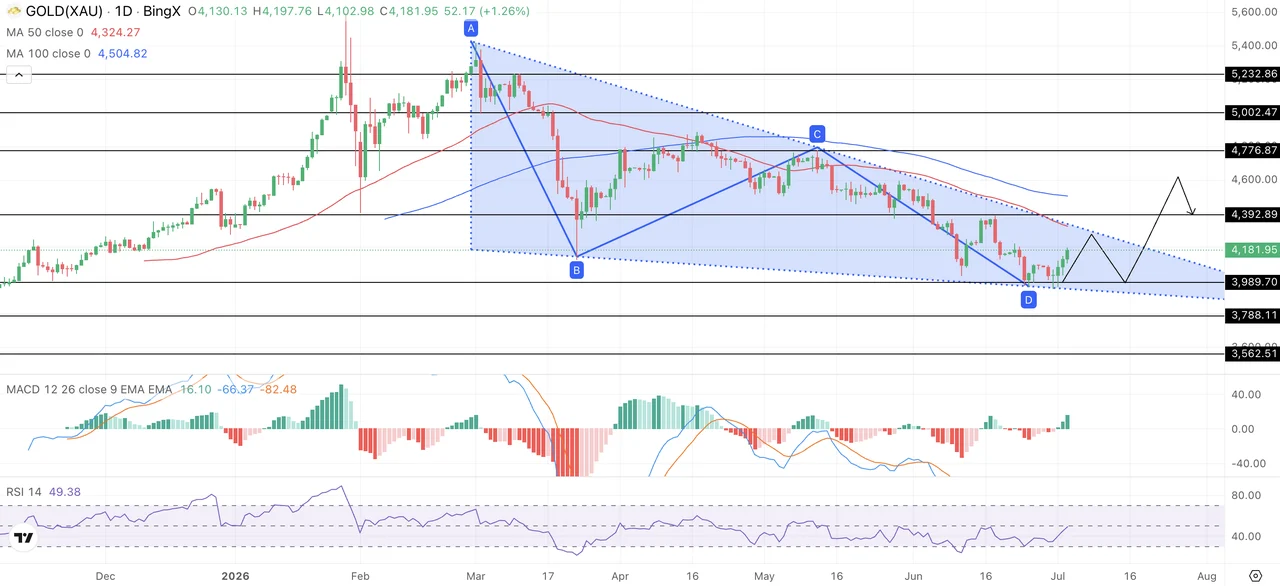
Gold reclaims $4,100
Physical gold has functioned as the primary beneficiary of the macro regime shift, accelerating its structural role as an inflation hedge and alternative store of value. Spot gold (XAU/USD) gained strong upward momentum immediately following the BLS release, surging past key technical resistance levels to trade near $4,125 during Friday's session.
The transmission mechanism is direct: the combination of falling 10-year Treasury yields and a weaker DXY dramatically lowers the opportunity cost of holding non-yielding bullion. With institutional reports from J.P. Morgan's Mid-Year Outlook highlighting gold's 130% cumulative advance over the past three years, the NFP data confirms gold's transition from a tactical defensive play into a primary allocation vehicle for sovereign and institutional treasuries hedging against sticky 3.5% wage inflation.
U.S. Equities Face Structural Divergence and AI Rotation
The equity markets delivered an internally fractured session that subverted standard "bad news is good news" models. While the Dow Jones Industrial Average added 1% to close at a record high of 52,845 points, buoyed by value-oriented components like Nike, Boeing, and Chevron, the tech-heavy Nasdaq 100 plunged 0.8% to 25,832, dragging the S&P 500 down a minor 0.1% to 7,476.
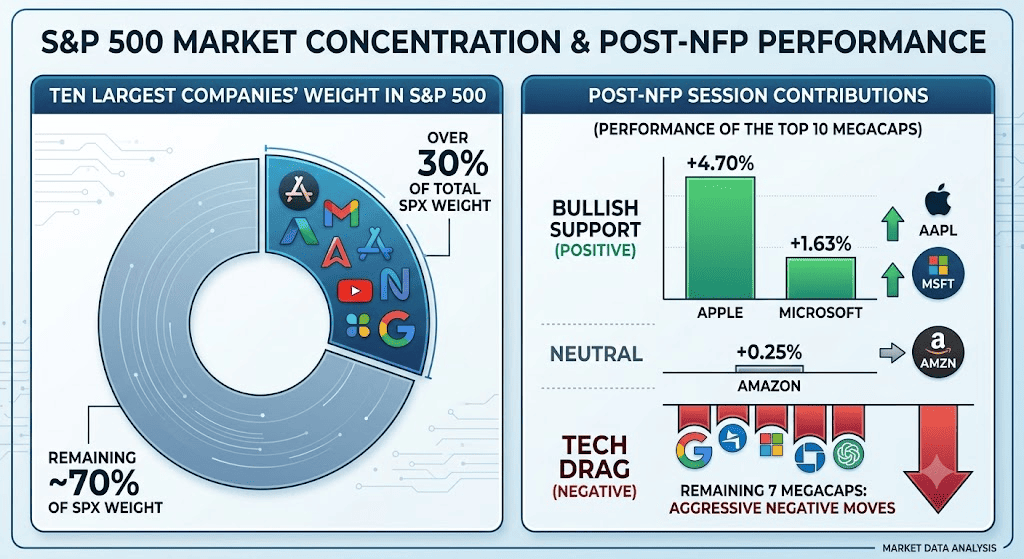
This divergence stems from severe profit-taking within the highly extended artificial intelligence and semiconductor ecosystems. High-volume names including SanDisk, Seagate, Western Digital, and Applied Materials suffered intraday losses exceeding 9%. The underlying driver is institutional concern over cost-of-capital sustainability: even with a softer NFP print, U.S. 10-year bond yields bounced back toward the 4.5% reference area, indicating that corporate bond markets continue to price in long-term structural inflation, capping the valuation multiples of high-beta tech equities.
The Crypto Market Establishes an On-Chain Bottom
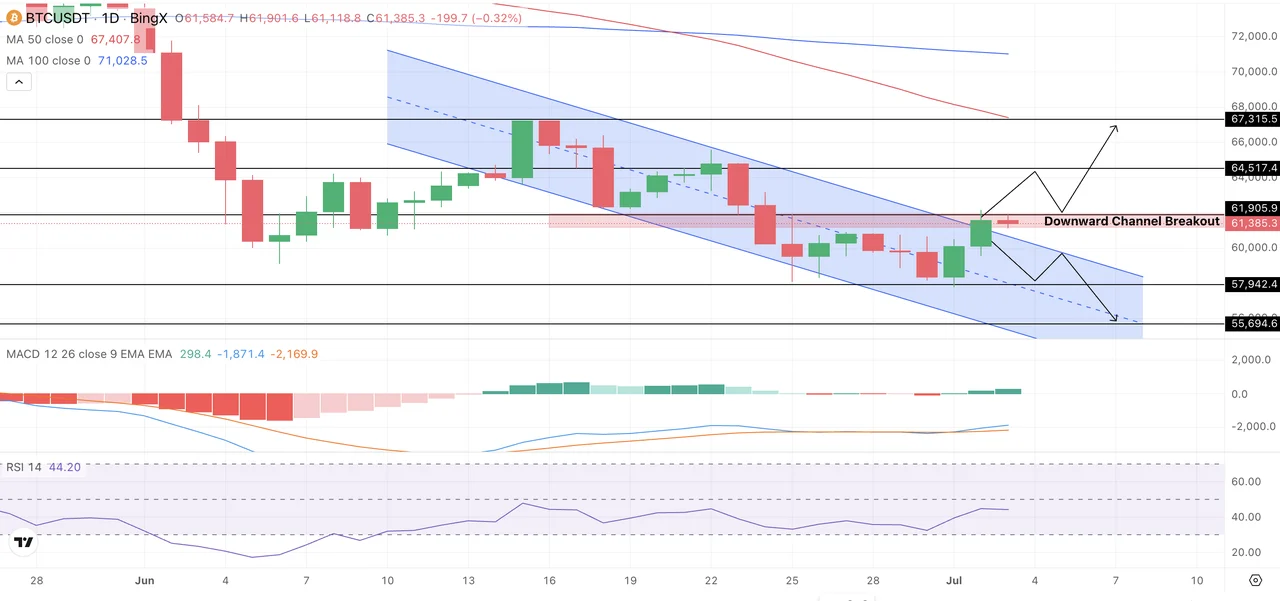
Bitcoin bounces above $61,000
Digital assets capitalized on the macro deceleration, with Bitcoin (BTC) firmly reclaiming the $61,000 threshold and distancing itself from its prior multi-day low of $57,750. The reduction in September rate-hike urgency triggered an immediate rotation of speculative capital out of the overextended AI equity sector and directly into liquid digital stores of value.
Despite near-term headwinds, including public equity anxiety over MicroStrategy’s $14 billion paper loss overhang on its 847,363 BTC position, on-chain structural metrics indicate definitive seller exhaustion. Net exchange reserves have retrenched to comprehensive multi-year lows, driven by a single-day migration of $850 million out of centralized order books into cold storage ($352.7 million in native BTC and $503 million in USDC). This severe thinning of exchange spot supply makes the crypto asset class highly responsive to any unexpected monetary expansion or further dollar index depreciation.
Structural Matrix: Global Cross-Asset Response Weights
|
Asset Class |
Immediate Price Level |
Post-NFP Vector |
Dominant Transmission Driver |
Macro Outlook Target |
|
U.S. Dollar (DXY) |
100.88 |
Negative / Stalled |
Collapse of July rate-hike premium; retreat from long-term 101.22 resistance. |
Support: 100.16Resistance: 101.98 |
|
Spot Gold (XAU) |
$4,125.00 |
Strong Positive |
Compression of real risk-free yields; sustained sovereign asset diversification. |
Support: $4,100Target: $4,250 |
|
S&P 500 (SPX) |
7,476.00 |
Neutral / Sideways |
Deep structural valuation drag from chipmakers vs. defensive value reallocation. |
Floor: 7,300Ceiling: 7,600 |
|
Bitcoin (BTC) |
$61,250.00 |
Positive Reversal |
Rotation out of tech equities; extensive exchange supply drainage to cold custody. |
Floor: $58,000Target: $65,000 |
Macro Inflexion and Range Boundaries: Key Levels to Watch
The convergence of sticky wage inflation and cooling payroll volumes has established highly sensitive range parameters across primary asset classes.
- The Equities Consolidation Zone (7,300–7,600): The S&P 500 remains locked within a formal sideways channel. The 7,600 level represents absolute psychological resistance matching all-time highs, while the 7,300 baseline serves as the definitive structural floor. The Relative Strength Index (RSI) hovering precisely at 50 confirms a near-term balance of power, requiring a clean breakout in underlying components before establishing directional momentum.
- The Dollar Inflection Boundary (99.49–101.22): For the DXY, a weekly close below the 100.16/42 low-week close will validate a technical top, exposing the June breakout origin at 99.49. Conversely, a systematic breach of the upper parallel slope at 101.22 would reactivate the broader bullish framework toward the May swing high of 101.98.
US Core Macro Catalysts in July 2026 Beyond the NFP Report
The structural regime shift under the Warsh Fed has significantly raised cross-asset volatility, making upcoming data releases high-impact binary events for macro portfolios.
|
Target Date |
Macro / Policy Milestone Event |
Operational Mechanics & Market Impact |
|
July 14, 2026 |
U.S. June CPI Inflation Print |
The core variable determining whether structural inflation is actively decelerating. Any drop below the 4.2% headline mark validates the NFP pause narrative. |
|
July 28–29, 2026 |
FOMC Meeting & Press Conference |
Chair Warsh's second official chairing. Markets will dissect policy text for the formalization of a "prolonged pause" and updates to the internal Dot Plot. |
|
August 2026 |
Bureau of Labor Statistics Revisions |
Annual baseline benchmark employment updates, vital for determining if H1 payroll expansions were structurally overstated. |
|
Continuous Q3 |
U.S.–Iran Doha Mediation Cycles |
Geopolitical tracking window. Progress or collapse directly governs crude oil volatility, feeding back into supply-side inflation expectations. |
- The Warsh Policy Constraints: Following his Senate confirmation, Fed Chair Kevin Warsh has dismantled forward guidance models to make policy highly reactive to data. While standard central banking frameworks would interpret a 57,000 NFP addition as an emergency call to ease, Warsh's stated reliance on non-obsolete, alternative indicators like the trimmed mean (currently at 2.4%) means the Fed will ignore structural labor softening if nominal wage growth remains stubbornly disconnected from the 2% inflation target.
- The Real Wage Drag: The report reveals that despite nominal wage growth matching consensus at 3.5% YoY, real wage growth stands at negative 0.7% for the second consecutive month. With U.S. consumption currently sustained by a depleted personal savings rate of just 3%, this contraction restricts consumer demand to the top income quintile, raising the tail risk of an abrupt consumer slowdown in late 2026.
- The World Cup Structural Illusion: The commencement of the FIFA World Cup across North America failed to generate the projected seasonal hiring buffer. Consensus models, including Goldman Sachs' target of plus 40,000 additions, were thoroughly subverted by a sharp 61,000 decline in the leisure and hospitality sectors, highlighting that corporate pricing pressures have restricted structural entry-level hiring.
Institutional Strategic Playbook: How Can Investors Prepare in the Short-Term?
Navigating an environment where the Federal Reserve refuses to provide forward guidance requires strict adherence to quantitative parameters over market sentiment.
Phase 1: Defensive Rebalancing and Allocation Lock-In (July 3 – July 14)
Capitalize on the immediate retreat in yields by locking in long spot gold allocations above the $4,100 structural wall. Concurrently, prune high-beta tech equity exposure that remains highly vulnerable to multiple compression under a 4.5% bond yield regime.
Maintain a neutral posture on the U.S. dollar. Do not add to aggressive macro dollar shorts until the upcoming June CPI data formally demonstrates a deceleration in headline inflation below 4.0%.
Phase 2: Post-CPI Tactical Directional Deployment (Post-July 14)
If U.S. CPI comes in cooler than expected alongside the soft June NFP, it will confirm a definitive policy pause by the Warsh Fed. Move to scale up leveraged positions in rate-sensitive growth equities and increase capital allocation to liquid digital assets like BTC and ETH as the market eliminates the September rate-hike tail risk.
If CPI prints hot (above 4.3%), the combination of sticky inflation and stalling growth will trigger acute stagflationary pricing. Immediately liquidate weak equity positions, hedge long crypto exposure, and return to cash/DXY as the market rushes to price the September rate hike back into order books.
Conclusion: The Institutional Macro Thesis
Traditional single-variable correlation models are temporarily broken as global macro capital processes a structural transition from quantitative growth tracking to rigorous inflation-price tracking. The latest U.S. labor data does not signal a classic economic collapse, but rather a structural rebalancing into a low-hire, low-fire environment complicated by an exodus of labor participation.
Asset allocators must maintain a highly disciplined, non-directional bias across broader index equities while concentrating capital in pure scarcity plays, specifically spot gold and native on-chain digital assets, which are structurally insulated from the negative real wage dynamics and corporate margin pressures currently developing across the traditional corporate landscape.
