
Executive Summary
The digital asset ecosystem arrived at its most critical pricing nexus of 2026 as Bitcoin (BTC) closed a punishing June down roughly 20%, briefly hitting a 21-month low of $57,749. The swift descent from the early Q2 peak of $82,814 down to the psychologically vital $60,000 boundary represents a structural regime shift forced by two nearly simultaneous liquidity shocks: the worst monthly net outflow record for U.S. spot Bitcoin ETFs since inception, and a hawkish policy pivot by newly appointed Federal Reserve Chair Kevin Warsh.
With the Crypto Fear & Greed Index registering an Extreme Fear level of 18, the prevailing market narrative has fundamentally inverted. The institutional debasement trade that drove BTC to its October 2025 all-time high of $126,223 has met a definitive macro ceiling as real risk-free yields remain structurally elevated. However, on-chain structural floor demand remains highly active, highlighted by aggressive whale accumulation and public corporate treasuries absorbing illiquid supply.
This deep-dive institutional report details the mechanical transmission chains, monetary milestones, regulatory bottlenecks, and systematic on-chain metrics governing Bitcoin’s price path over the next two quarters of 2026.
Bitcoin's Core Macro Catalysts in H2 2026 and Regulatory Timeline
Historically, Bitcoin has traded as a highly responsive liquidity sponge. The first half of 2026 has introduced severe structural friction across legislative and central banking axes, shifting institutional time horizons into the late-year window.
|
Target Date |
Macro / Policy Milestone Event |
Operational Mechanics & Market Impact |
|
July 14, 2026 |
U.S. CPI Data Release |
Core gauge for short-term rate expectations. A cooler print serves as the immediate binary catalyst to alleviate risk-asset suppression. |
|
July 28–29, 2026 |
FOMC Meeting (Warsh's Second Chairing) |
The primary macro variable. Markets look for a continuation of the "no forward guidance" stance or formalization of a rate-hike bias. |
|
August 2026 Recess |
U.S. CLARITY Act Senate Floor Deadline |
Legislative window for regulatory framework clarity. Failure to pass before recess slips execution timelines into late fall or 2027. |
|
Continuous H2 |
U.S. GENIUS Act Implementation |
Finalization of comprehensive U.S. stablecoin rules, accelerating structural compliant fiat on-ramps. |
- The Warsh Macro Shock: Following his historic 54:45 Senate confirmation, Fed Chair Kevin Warsh's June 17 debut meeting shattered market assumptions by holding the benchmark rate steady at 3.50%–3.75% while removing forward guidance. With half of the 18 FOMC officials projecting a rate increase in 2026, the market has completely unwound its rate-cut pricing.
- The CLARITY Act Bottleneck: Bipartisan negotiations over ethics clauses collapsed on June 9, obliterating the White House's initial July 4 signing target. The bill, which reduces institutional compliance risk by defining CFTC and SEC boundaries, requires 60 Senate votes. It currently secures 2 cross-party Democratic votes, needing 7 more to avoid a total timeline slip.
- The Geopolitical Drag: A fragile ceasefire in the Middle East remains highly sensitive, with Iran ruling out high-level direct talks with U.S. envoys in Doha. Elevated energy tailwinds continue to threaten supply-side inflation, providing fundamental coverage for the Fed's hawkish stance.
Quantitative Modeling of BTC's Order Book: Capital Flow Tiers and Liquidity Metrics
A rigorous cross-sectional analysis of spot market volumes, derivatives premiums, and corporate treasuries reveals four distinct capital vectors acting on the BTC order book.
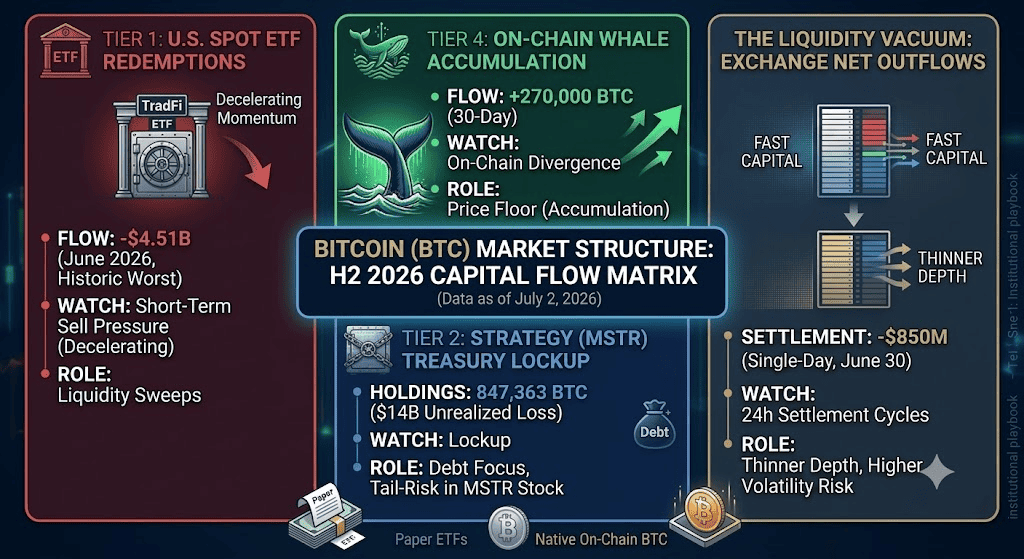
Tier 1: U.S. Spot ETF Redemptions, the Leading Capital Flow Indicator
The institutional gateway has transitioned from a source of aggressive marginal demand into a massive liquidation channel. U.S. spot Bitcoin ETFs recorded a historic $4.51 billion in net outflows in June 2026, outstripping the previous record of $3.56 billion set in February 2025. Aggregate ETF assets under management have retrenched to $72.8 billion from early-year highs near $104 billion. Q1 13F filings confirm that reporting institutions scaled back their collective balance sheet exposure by 17%, dropping aggregate holdings from 313,000 BTC to 261,000 BTC.
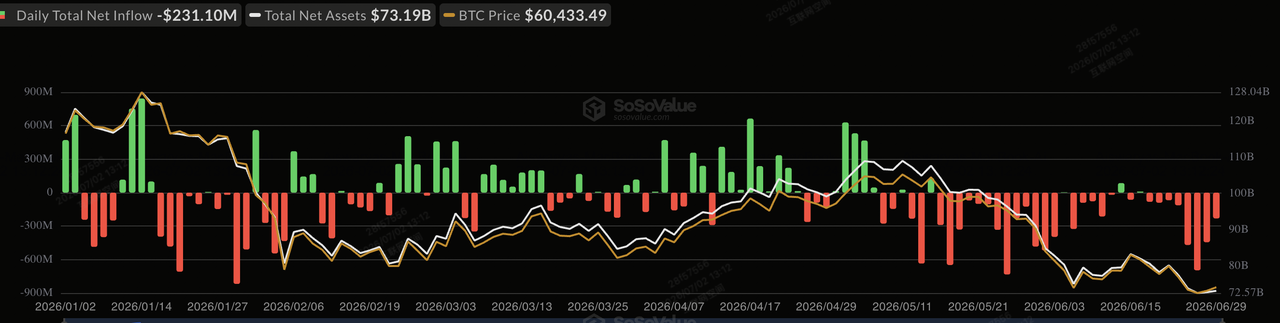
Daily spot Bitcoin ETF flows in H1 2026 | Source: SoSoValue
The Coinbase Premium Index has maintained a negative posture for roughly 8 weeks, demonstrating that the marginal sell pressure is heavily domestic and U.S.-session concentrated.
This historic outflow indicates that the TradFi institutional bidding momentum has temporarily broken. Because ETF flows have historically acted as a leading indicator for Bitcoin’s short-term price discovery, leading by 1–3 weeks, this sustained structural selling directly drains the market of marginal fiat inflows. The persistent negative Coinbase premium structurally validates that American institutions are aggressively reducing risk asset exposure, leaving Bitcoin heavily dependent on offshore spot buying and local on-chain support to defend the $58,000 baseline.
Tier 2: Corporate Treasury and Digital Asset Treasury Companies (DATCOs)
Public equity-linked accumulation models are experiencing their first prolonged structural stress test as paper losses expand significantly.
Strategy (MSTR)'s Bitcoin Exposure
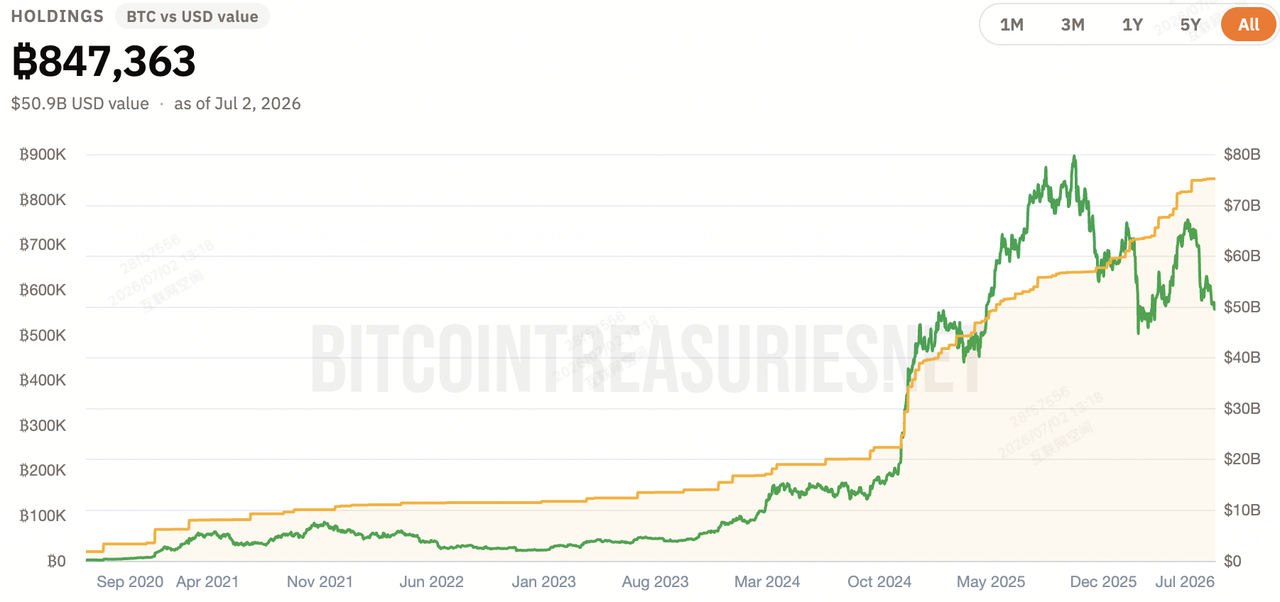
Strategy's Bitcoin holdings | Source: Bitcoin Treasuries
Holds a massive reserve of 847,363 BTC at an average cost basis of approximately $75,651. With spot prices hovering near $60,000, Strategy (MSTR)'s unrealized paper losses sit at a staggering $14 billion. Market participants are heavily discounting the tail-risk sustainability of MSTR’s financing structure, specifically its Short-Term Resilient Convertible (STRC) preferred share layer.
While Strategy's massive stack remains structurally locked up and insulated from immediate forced liquidation, the scale of this $14 billion paper loss introduces a heavy psychological overhang. The market is actively pricing in tail-risk surrounding financing stress; if MSTR stock experiences deep corporate drawdowns, it risks feeding a negative loop back into Bitcoin's spot price, altering the corporate reserve narrative from a long-term supply sink into a potential source of macro market anxiety.
Other Marginal Buyers
Japan's Metaplanet completed a $5.31 billion corporate capital raise to continue its programmatic treasury accumulation, and Hyperscale Data added 49.25 BTC on July 1. However, structural corporate buying has lost its ability to shock the order book, as evidenced by muted price reactions to recent purchase announcements.
This reveals a clear saturation point in the corporate treasury narrative. While firms like Metaplanet and Hyperscale Data provide a reliable, long-term structural floor by absorbing circulating supply, their marginal purchasing power is no longer sufficient to catalyze upward momentum on its own. In July 2026, Bitcoin's corporate accumulation has successfully transitioned into a passive safety net rather than an active driver of short-term price spikes.
Tier 3: Macro Brokerage Expansion and Tech Infrastructure
Countering near-term capital flight, major retail and institutional fintech rails are aggressively scaling product access and enhancing network security, establishing a sturdier infrastructure for the next cyclical leg. While these metrics do not immediately reverse current ETF redemptions, they directly expand retail distribution channels and mitigate high-level institutional onboarding friction:
Robinhood Public Mainnet and Zero-Fee Friction Reduction
On July 1, 2026, Robinhood officially launched its public mainnet Robinhood Chain, rolled out zero-fee Maker/Taker Orders for U.S. clients, and expanded spot crypto trading to the United Kingdom.
By eliminating execution fees for high-volume market participants and expanding spot access across the UK, this framework dramatically lowers retail transaction friction. It effectively primes the retail liquidity pipeline to act as an immediate demand multiplier once macro sentiment shifts out of Extreme Fear.
Network Privacy and Cryptographic Self-Custody Upgrades
Under-the-hood protocol refinements completed on June 30 patched a critical privacy flaw in the PrivateBroadcast feature, which previously risked leaking node IP addresses, and enhanced MuSig2 multi-signature protocol configurations to reject invalid key formats during transaction setups.
These network fundamental enhancements drastically optimize corporate and institutional self-custody pathways. Resolving the IP-leak vulnerability ensures compliance-minded corporate treasuries can run nodes securely without compromising proprietary network positions, while the MuSig2 safety guardrails eliminate catastrophic single-point-of-failure risks in collaborative multi-sig custody models. This significantly lowers operational risk barriers for traditional financial capital waiting to allocate directly on-chain.
Tier 4: On-Chain Whale Accumulation and Miner Exhaustion
The strongest counter-trend divergence is materializing directly on-chain, exposing a stark division between paper market selling and physical asset absorption.
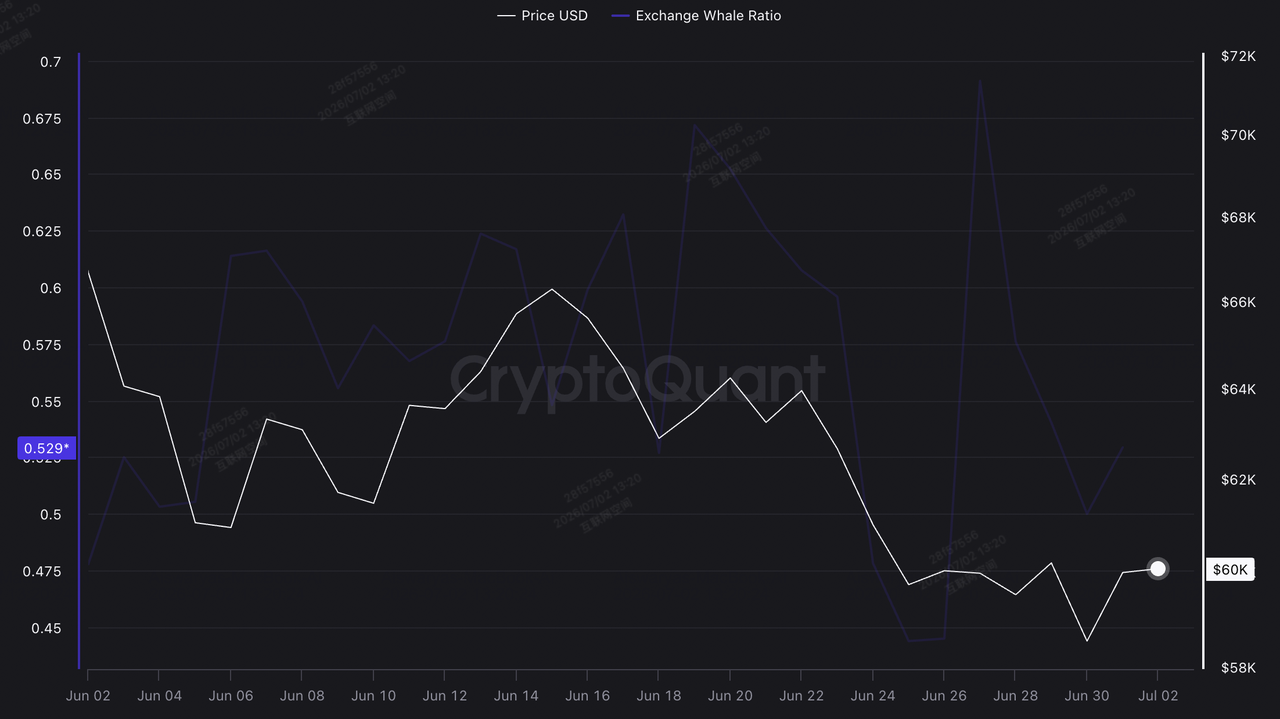
Bitcoin's exchange to whale ratio | Source: CryptoQuant
- The Whale Divergence: According to CryptoQuant data, whale entities have net-accumulated over 270,000 BTC over the past 30 days. This represents a sharp accumulation phase that runs completely counter to the multi-billion-dollar ETF redemptions.
- Exchange Depletion: Centralized exchange reserves have reached comprehensive 7-year lows. On June 30 alone, a net $850 million in capital, including $352.7 million in native BTC and $503 million in USDC, was withdrawn from centralized order books, pointing to extensive liquidity migration into cold storage and institutional settlement networks.
Structural Matrix: Total BTC Capital Directional Weights
|
Capital Vector / Tier |
Estimated Volume / Scale |
Market Window |
Operational Trajectory & Target |
|
Spot ETF Redemptions |
-$4.51B (June Aggregate) |
Daily Liquidity Sweeps |
Dominant Short-Term Sell Pressure (Decelerating) |
|
Whale Accumulation |
+270,000 BTC (30-Day) |
Continuous On-Chain |
Primary Macro Price Floor (Aggressive) |
|
Strategy (MSTR) Treasury |
847,363 BTC ($14B Unrealized Loss) |
Structural Lockup |
Debt Service Focus; Tail-Risk Discounting |
|
Exchange Net Outflows |
-$850M (Single-Day Frame) |
24h Settlement Cycles |
Order Book Thinning; Heightened Volatility |
Technical Frameworks: Squeeze Zones and Breakdown Targets for Bitcoin Price
The reduction of spot exchange reserves, coupled with compressed order book depth across major domestic venues, has created a highly path-dependent environment where short-term moves are magnified.
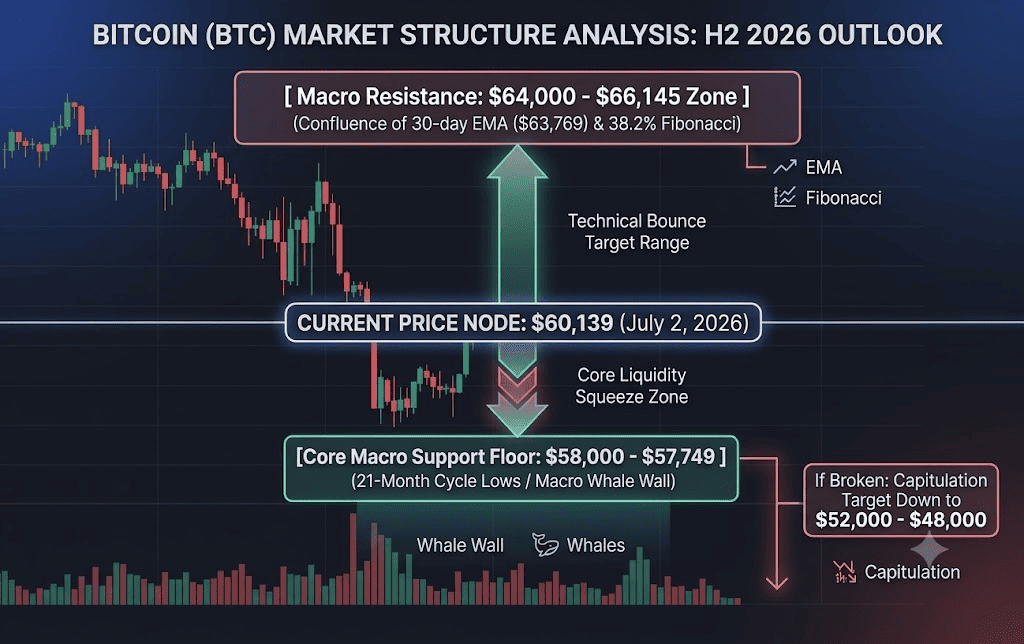
- The Squeeze Zone ($58,000–$60,000): This range represents the primary battleground. Historical cycle data from the 4-year halving model suggests that post-peak bear phases typically stretch through Q3. Citigroup’s revised downside modeling maps a bear-case target of $53,000 if macroeconomic conditions deteriorate further.
- The Reversal Target ($64,000–$66,145): A structural trend reversal requires a clean daily close above the June monthly Anchor VWAP ($63,417) and the 38.2% Fibonacci retracement level at $66,145. Achieving this would signal a short-squeeze capable of drawing trend-following institutional allocators back into the market.
Bitcoin's Strategic Trading Playbook: Risk Management Matrix in H2 2026
Navigating the current neutral-to-bearish H2 macro ceiling requires strict adherence to quantitative indicators over sentiment.
Phase 1: Defensive Accumulation and Macro Confirmation (July 2 – July 29)
Bitcoin's price action remains structurally capped by the Federal Reserve's hawkish stance. Strategic long accumulation should be constrained to confirmed tests of the $58,000 structural wall.
Do not mistake brief technical bounces for full cycle reversals. Institutional execution desks must wait for 3 consecutive days of net spot ETF inflows exceeding $100 million/day alongside a positive Coinbase Premium before scaling into heavy spot or leveraged long exposure.
Phase 2: The Macro Reversal or Capitulation Breakdown (Post-July FOMC)
- The Downside Trigger: A daily close below $57,700 invalidates the current technical bottom thesis. If triggered, positions must be hedged or systematically closed out to protect capital against a rapid, leverage-driven cascade down to the $52,000–$48,000 capitulation window.
- The Upside Trigger: Progress on the CLARITY Act coinciding with a softer tone from Kevin Warsh during the July 29 press conference will mark the macro bottom. Target an immediate upside re-allocation as the market prepares to price in an accelerated run-up into the late 2026/2027 recovery leg.
Conclusion: What Is Bitcoin's Institutional Thesis for H2 2026?
Traditional fundamental evaluation models remain temporarily detached from asset pricing as the market digests the structural transition from public ETFs back to native on-chain liquidity networks. Bitcoin's current market structure is a classic tug-of-war between a rigid macro liquidity ceiling and an aggressive, historically sound on-chain whale accumulation floor.
Traders should maintain a cautiously neutral bias through Q3, utilizing the tight $58,000 support level to manage defensive risk parameters, while actively preparing capital deployments for a confirmed structural trend reversal in early Q4.
