Join the Trading Community: Learn & Earn with BingX.
Source: TradingView & BingX
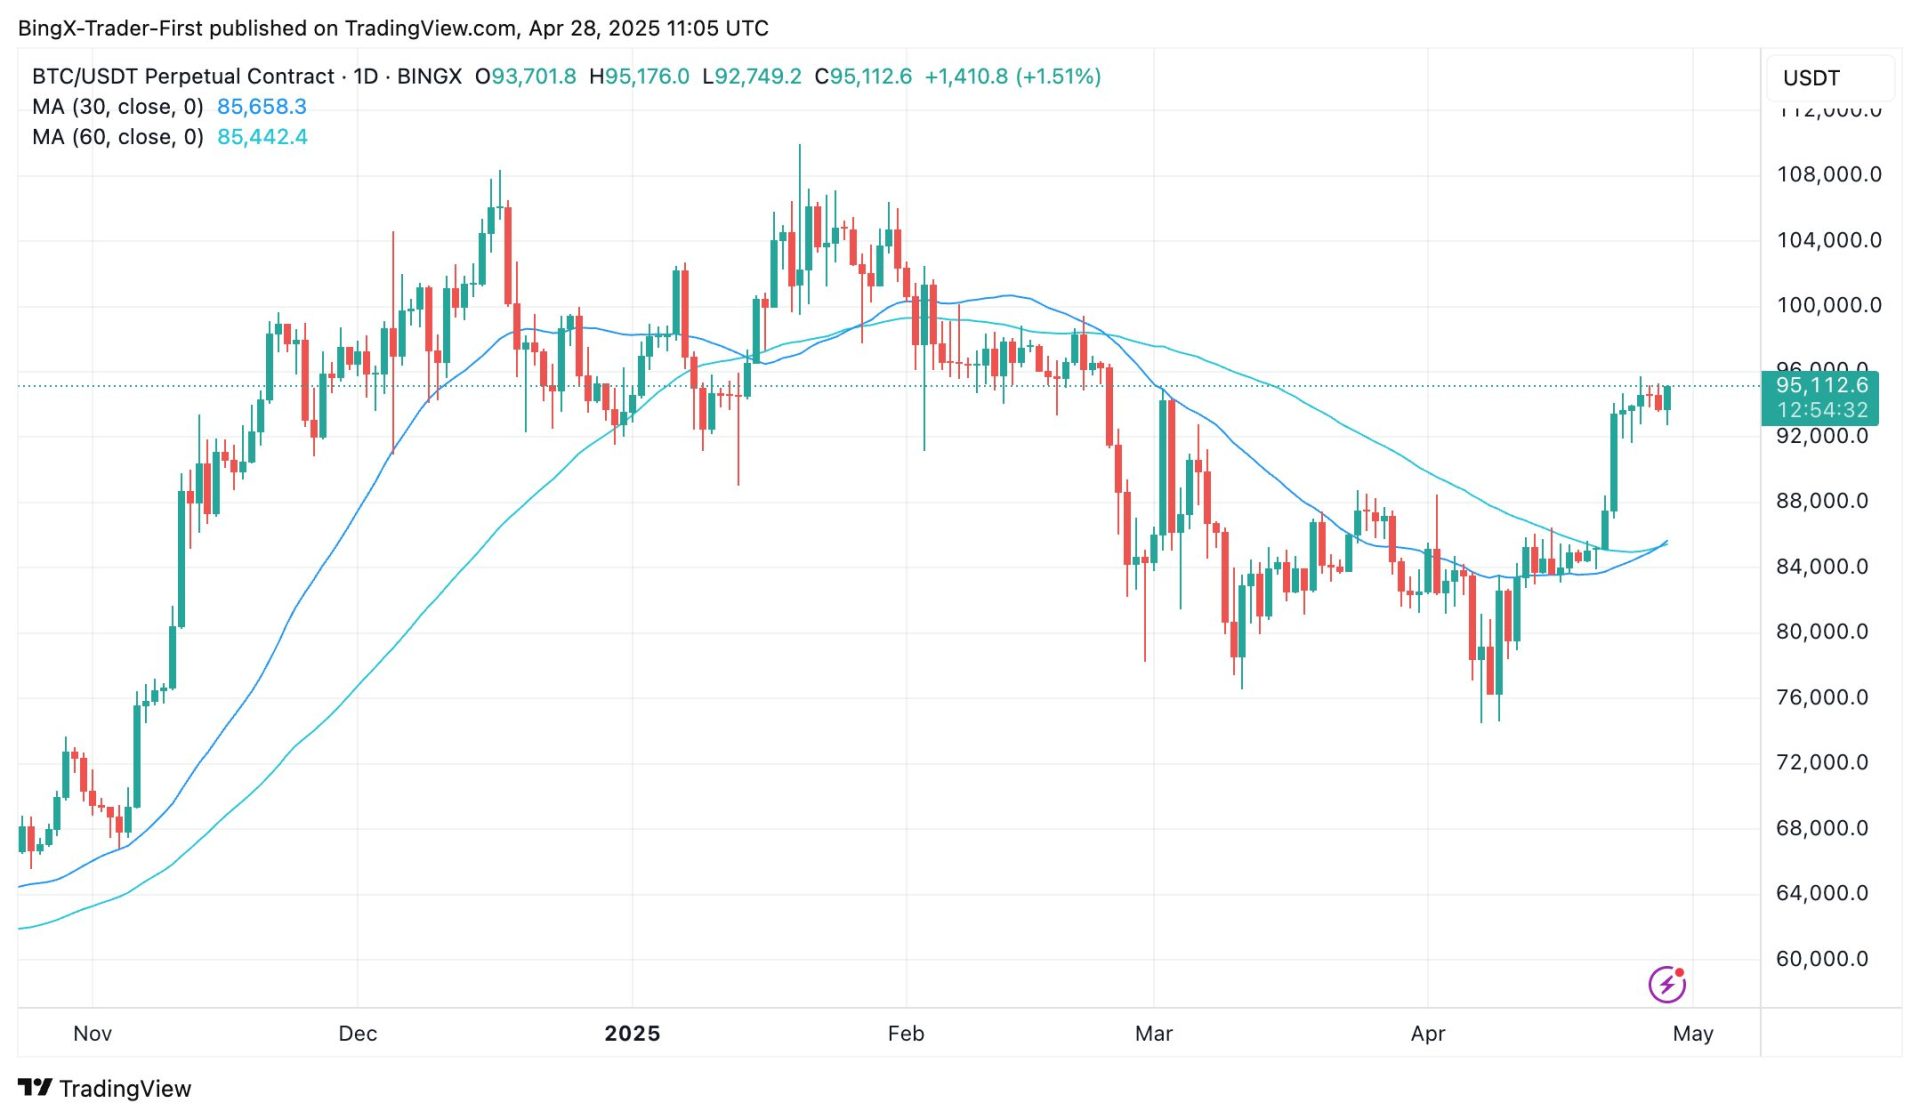
The 4-hour chart for BTC/USD shows Bitcoin trading at $95,112 as of April 28, 2025, reflecting a slight increase of 1.51% from recent levels. The price has experienced a recovery from a low of $92,749 earlier in the period, now approaching resistance near $95,758, which aligns with prior highs. The 30-period moving average, at $85,658.3, and the 60-period moving average, at $85,442.4, remain below the current price, indicating that the short-term trend remains bullish. The candlestick patterns show a mix of volatility, with a recent bullish push supported by increased volume, suggesting renewed buying interest. The RSI on the 4-hour chart is at 52.22, indicating neutral momentum, while the MACD suggests a potential bullish crossover, suggesting possible upward momentum in the near term.
On the 1-day chart, Bitcoin’s broader trend remains in focus, with the price having climbed from $74,508 in early December 2024 to a peak of $95,112 recently. The daily chart shows the price breaking above a key trendline resistance that had previously capped gains, suggesting a continuation of the bullish trend. However, the price is now testing the upper boundary of a long-term channel, which could act as resistance around the $95,000-$96,000 range. Volume on the daily chart has spiked during recent upward moves, indicating strong buyer participation, though the MACD on this timeframe shows a slight divergence, suggesting caution as momentum may be slowing. The 200-period moving average, currently at $89,861.60, continues to slope upward, supporting the overall bullish trend.
From a technical standpoint, Bitcoin’s position on both the 4-hour and 1-day charts indicates a pivotal moment. The 4-hour chart’s neutral RSI and potential bullish MACD crossover suggest short-term strength, but the price must clear $95,758 to confirm further upside. On the daily chart, the break above the trendline is positive, but the upper channel resistance near $96,000 could pose a challenge. Traders might monitor for a sustained move above $96,000 to signal continued bullish momentum, or a drop below $92,749 could indicate a deeper pullback, with support near $89,000 based on the 200-period moving average.
Disclaimer: BingX does not endorse and is not responsible for or liable for any content, accuracy, quality, advertising, products, or other materials on this page. Readers should do their own research before taking any actions related to the company. BingX is not responsible, directly or indirectly, for any damage or loss caused or alleged to be caused by or in connection with the use of or reliance on any content, goods, or services mentioned in the article.