
In early May 2026, U.S. retail gasoline prices sit at a critical macroeconomic junction. After a sharp escalation in geopolitical tensions that saw national averages spike to $4.58 in some regions, the energy complex is coiling for its next major move. While the U.S. Energy Information Administration (EIA) has revised its annual average forecast upward to $3.70 per gallon, the market remains hyper-sensitive to shut-ins affecting nearly 13 million barrels of oil per day. Investors are now balancing a structural supply deficit against a potential global economic slowdown and the long-term deflationary pressure of electric vehicle (EV) adoption.
As energy security dominates the 2026 narrative, gasoline’s volatility is shifting from seasonal patterns to strategic geopolitical shifts. With the Strait of Hormuz disruption significantly constraining global flows, this guide breaks down the gasoline price prediction for 2026 using data from the EIA, GasBuddy, AAA, and J.P. Morgan.
You will also discover how to trade Gasoline futures with USDT through BingX TradFi.
Top 5 Things for Gasoline Traders to Know in 2026
As gasoline navigates an environment of supply shocks and refinery constraints, traders must monitor these five market-moving factors:
- The Geopolitical Risk Premium: The closure of the Strait of Hormuz has removed roughly 20% of global oil and gas supplies from the market, adding an estimated $20–$30 per barrel war premium to crude oil.
- Refinery Bottlenecks: Beyond crude costs, domestic refinery outages in the Midwest at Whiting and Joliet have created regional fuel deserts, pushing local prices significantly above the national average.
- The $96 Brent Anchor: The EIA’s 2026 outlook is benchmarked against Brent crude averaging $96/bbl. Any deviation in crude prices, upward toward $120 or downward toward $70, will immediately impact the pump.
- Demand Elasticity vs.EVs: While high prices traditionally trigger demand destruction, the accelerating transition to EVs is beginning to exert a structural cap on long-term gasoline consumption.
- Strategic Petroleum Reserve (SPR) Levels: Market participants are closely watching for potential government interventions or inventory releases from major importing nations like Japan and the U.S. to cushion price spikes.
What Drives Gasoline Prices?
Retail gasoline prices are a composite of four primary inputs. In 2026, crude oil costs account for approximately 51% of the total price, followed by taxes (17%), distribution (17%), and refining costs (14%).
As of May 2026, the market is defined by inelastic supply. Unlike consumer goods, global energy infrastructure cannot quickly pivot when major transit routes are blocked. On the BingX TradFi platform, traders can speculate on these movements through WTI and Brent Crude CFDs, providing a way to hedge against rising fuel costs at the pump.
Trading energy in 2026 utilizes a specialized ecosystem of benchmarks, primarily the RBOB Gasoline (RB) futures and international crude benchmarks. As the national average trades near $4.48/gal, these instruments serve as critical vehicles for navigating volatility driven by the conflict and seasonal 'summer driving' demand.
Gasoline’s Performance in 2025: A Review
In 2025, the U.S. gasoline market operated within a remarkably tight band of relative stability, with national retail averages anchored near $3.10 per gallon. This price floor was sustained by a robust domestic supply side, as U.S. crude production consistently hit record highs of 13.2–13.4 million barrels per day (bpd), effectively offsetting the production cuts maintained by OPEC+. Throughout the year, high refinery utilization rates, often exceeding 92% capacity, ensured that finished gasoline inventories remained at or above five-year averages. This equilibrium provided a low-volatility environment for traders, where 'pain at the pump' was largely mitigated by the lack of significant supply-chain shocks or major geopolitical escalations in energy-producing regions.
However, this 'calm before the storm' fundamentally shifted in late February 2026, as the onset of Middle East hostilities abruptly re-introduced a massive geopolitical risk premium. The near-closure of the Strait of Hormuz triggered an unprecedented supply disruption, forcing a re-evaluation of global benchmarks as Brent crude spiked from the mid-$70s to over $110 per barrel. For tactical traders, the transition from 2025's range-bound market to 2026’s high-delta environment saw wholesale RBOB gasoline prices surge nearly 90% in a 90-day window. This shift effectively ended a period of demand-driven pricing and ushered in a supply-scarcity era, where regional bottlenecks, such as the $2.25 price gap between the Gulf Coast and California, have become the primary drivers of volatility.
Gasoline 2026 Investment Outlook: $4.50 Peak vs. $3.00 Mean Reversion
Gasoline price prediction for 2026 by vaious analysts
Navigating the 2026 gasoline market requires a strategic understanding of three probability-weighted outcomes shaped by regional conflict, refinery elasticity, and global macro shifts.
The Bull Case: The $4.50+ Geopolitical Peak for Gasoline Prices in 2026
The bullish narrative centers on a Long War scenario where sustained damage to Middle Eastern oil infrastructure leads to a permanent supply-side fracture. If the Strait of Hormuz remains severely constrained through Q3 2026, the EIA warns that global shut-ins could peak at 13.7 million bpd, creating a physical deficit that global inventories cannot bridge. In this environment, the geopolitical risk premium remains fully priced in, driving WTI crude toward the $115–$120 range and pushing U.S. national gasoline averages toward a $4.80–$5.10 breakout.
For traders, this transforms gasoline into a high-alpha scarcity asset. Practical focus shifts to fuel deserts and regional bottlenecks; in this scenario, California and the Pacific Northwest, already burdened by isolated supply chains and high taxes, would likely test $7.00 per gallon. Investors should monitor crack spreads and refinery margins, as limited supply will favor midstream players with operational capacity, while retail demand shifts toward essential-only consumption, effectively capping upside only when extreme demand destruction occurs.
The Base Case: Can Gasoline Consolidate Between $3.50 and $3.90?
The base case, aligned with the EIA’s April STEO, envisions a Gradual Normalization following a projected diplomatic resolution by mid-year. This scenario assumes that while the conflict ends, the reopening of energy corridors is a multi-month process, keeping the 2026 annual average anchored at $3.70 per gallon. Retail prices would likely peak near $4.30 in the second quarter before a seasonal and supply-driven retreat toward the $3.55 mark by Q4, as production levels in Iraq and Kuwait slowly return to their pre-war baseline of 9.1 million bpd.
This outcome creates a high-volatility, range-bound environment ideal for tactical mean reversion trades. Insightful traders will focus on the 90% surge in RBOB wholesale prices cooling off as refinery utilization rates in the U.S. Gulf Coast return to the 92–94% efficiency zone. The investment strategy here is to track monthly inventory drawdowns; a transition from deficit to average stock levels will act as the primary signal that the price ceiling has been established and the market is entering a distribution phase.
The Bear Case: Gasoline's $3.00 Demand Destruction Trap
The bearish scenario, championed by institutional voices like J.P. Morgan, is triggered by a Macro-Skunk event where sustained high energy costs finally fracture global consumer spending, sparking a sharp economic contraction. As the World Bank warns of cumulative waves of inflation, a drop in consumer discretionary income leads to a rapid collapse in vehicle miles traveled (VMT). This demand destruction is exacerbated by structural headwinds, including the accelerating adoption of EVs and a 6.3% projected increase in LNG exports, which provides an alternative energy cushion for industrial sectors.
Technically, the bear case is confirmed if national averages break the $3.40 support line, signaling that the war premium has been entirely liquidated. In this hard-landing environment, crude oil could retreat toward $60–$65/bbl, as non-OPEC production from the U.S. and Brazil floods a shrinking market. For investors, this represents a pivot from inflation hedge to recession risk, where the focus shifts from supply constraints to a surplus reality, potentially dragging gasoline prices back to their 2025 baseline of $3.10 or lower by early 2027.
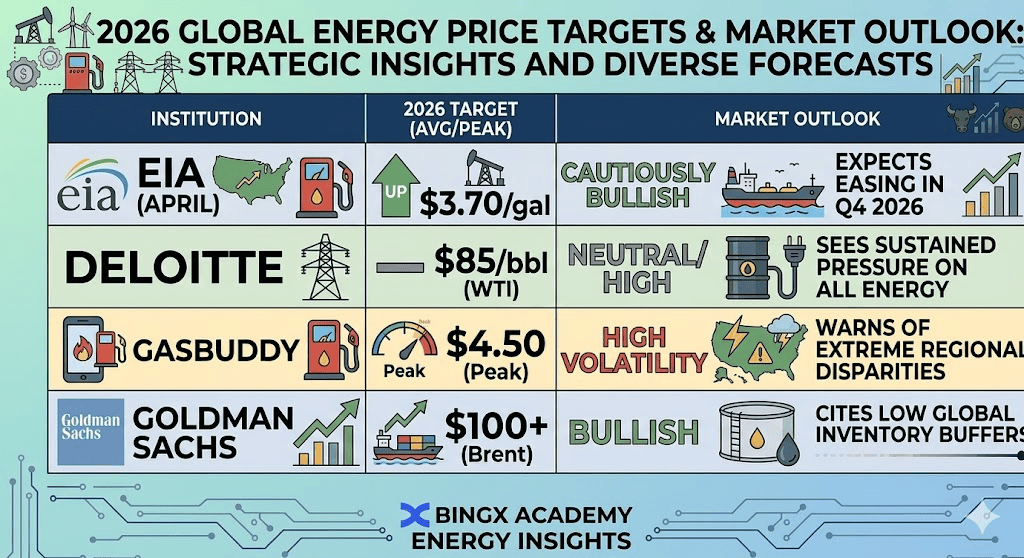
Gasoline Price Forecasts for 2026 by Analysts
|
Institution |
2026 Target (Avg/Peak) |
Market Outlook |
|
EIA (April) |
$3.70/gal |
Cautiously Bullish: Expects easing in Q4 2026. |
|
Deloitte |
$85/bbl (WTI) |
Neutral/High: Sees sustained pressure on all energy. |
|
GasBuddy |
$4.50 (Peak) |
High Volatility: Warns of extreme regional disparities. |
|
Goldman Sachs |
$100+ (Brent) |
Bullish: Cites low global inventory buffers. |
How to Trade Gasoline Futures on BingX TradFi
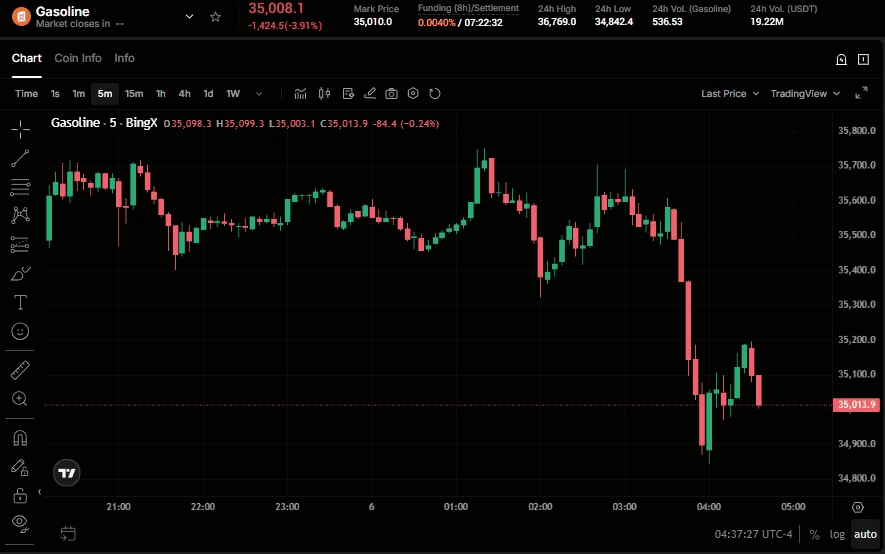
Gasoline-USDT perpetual contract on BingX futures
Capitalize on energy volatility using BingX TradFi. Whether you are hedging your business’s fuel costs or betting on a geopolitical resolution, BingX provides the tools needed to trade the commodity cycle.
- Access BingX TradFi: Navigate to the Commodities section on BingX TradFi market.
- Select Your Instrument: Choose Gasoline-USDT to track the primary drivers of gasoline.
- Choose Your Direction: Open Long if you anticipate further supply disruptions, or Open Short if you believe the peak is behind us.
- Manage Risk: Use Stop-Loss (SL) orders to protect against sudden ceasefire price drops.
Top 5 Risks to Watch for Gasoline Traders in 2026
Effective risk management in the 2026 energy market requires a granular focus on the catalysts that can trigger rapid price reversals or supply-chain dislocations.
- State and Federal Policy Interventions: As prices sustain levels above $4.40/gallon, the risk of government intervention increases. Traders must watch for Gas Tax Holidays in high-cost states like California or a massive release from the Strategic Petroleum Reserve (SPR), which can flood the market with millions of barrels of sweet crude, triggering a flash crash in retail price expectations.
- The Ceasefire Liquidity Pivot: The energy market is currently pricing in a significant Strait of Hormuz premium. A verified diplomatic breakthrough or a permanent ceasefire could trigger a rapid unwind of speculative long positions, potentially erasing $20–$25 from crude benchmarks and dropping gasoline spot prices by 40–60 cents in a single trading week.
- Cyclical Demand Destruction: While supply is tight, gasoline demand is not infinite. A hard landing for the U.S. Economy, characterized by rising unemployment and a contraction in consumer discretionary spending, could drive Vehicle Miles Traveled (VMT) to record lows, creating a demand-side surplus that overrides current geopolitical scarcity.
- Gulf Coast Hurricane Season in Q3): With global inventories already thin, any meteorological disruption in the Gulf of Mexico is magnified. A major hurricane landfall could sideline 10–15% of total U.S. refining capacity of approx. 2–3 million bpd, causing localized retail price spikes even if global crude prices remain stable.
- US Dollar (DXY) Strength: Since gasoline is a dollar-denominated commodity, a surging U.S. Dollar makes fuel imports more expensive for emerging markets in Asia and South Asia. This currency tax could lead to a sharp drop in global export demand for U.S. refined products, ultimately forcing domestic inventories higher and pressuring RBOB futures.
Final Thoughts: How High Can Gasoline Prices Go in 2026?
As of May 2026, the convergence of geopolitical risk and infrastructure constraints suggests the market has entered a plateau of volatility. While the current national average of $4.48 per gallon likely represents the near-term fear peak driven by the Strait of Hormuz closure, the structural floor for gasoline has shifted significantly higher than 2025 levels. For the remainder of the year, price action will likely be dictated by the speed of supply-chain normalization; a swift diplomatic resolution could see a retracement toward the $3.50 technical support zone, whereas any further damage to West Coast or Midwest refining hubs could solidify a new baseline above $4.00.
For market participants, 2026 requires a transition from passive observation to active risk monitoring. Success in this environment depends on tracking high-frequency data, specifically the EIA’s weekly inventory reports and refinery utilization rates, which currently serve as the primary indicators of physical tightness. By monitoring the 90% RBOB wholesale surge against retail price lag, traders can better anticipate pump shocks before they materialize. In this high-stakes landscape, gasoline is no longer merely a fuel source but a critical barometer of global stability and inflationary pressure.
Risk Reminder: Trading energy commodities involves significant capital risk due to extreme price volatility and geopolitical sensitivity. The energy market is subject to rapid reversals based on diplomatic news, seasonal weather events, and government policy shifts. Always implement strict stop-loss orders, manage leverage conservatively, and never trade with capital you cannot afford to lose.
Related Reading
- Natural Gas Price Prediction 2026: $15 Global Energy Shock or U.S. Glut Trap?
- Crude Oil Price Forecast 2026: $140 War Premium or $60 Surplus Baseline?
- Occidental Petroleum (OXY) Price Prediction 2026: $115 Net-Zero Alpha or $55 Commodity Trap?
- Exxon Mobil (XOM) Price Prediction 2026: $180 Energy Alpha or Geopolitical Value Trap?
- XOP S&P Oil & Gas ETF Prediction 2026: $210 Geopolitical Moonshot or $130 Hedge Trap?
