
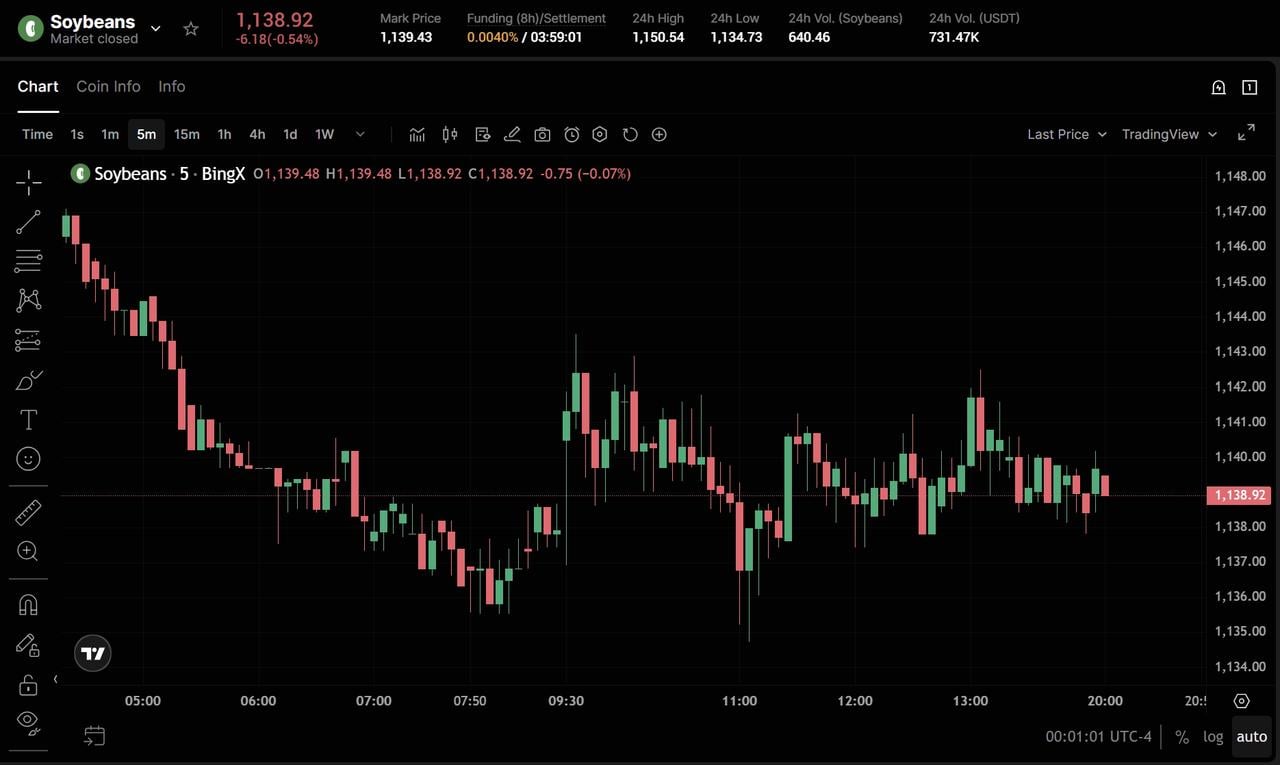
In mid-June 2026, the agricultural markets find themselves at a crucial technical crossroads. After a powerful 15% vertical rally that drove new-crop November soybean futures from a January low of $10.55 per bushel up to an annual peak of $12.14 on May 13, prices have given up their near-term upside steam. A dramatic shift in macro narratives, headlined by the long-awaited U.S.-Iran peace agreement that has deflated benchmark energy markets, slammed crude oil to three-month lows and pulled soybean futures back to the $11.35 zone.
Yet, beneath the near-term volatility lies a historically unique structural footprint. While the geopolitical risk premium that drove cash beans into the mid-$12s in early Q1 is cooling, domestic demand for soybean products remains white-hot. U.S. processors are operating at a record crushing pace, legally anchored by the EPA’s aggressive Renewable Volume Obligations (RVO) targets for 2026 and 2027. Investors are now actively parsing whether this domestic structural deficit will insulate the complex, or if a massive supply-side shift, including a near-record 4.435-billion-bushel U.S. harvest and expansion in Brazil, will trigger an aggressive unwinding of speculative length.
This comprehensive guide breaks down the structural mechanics of the Soybean price prediction for 2026 using data from the June USDA WASDE report, the CME Group, Chicago Board of Trade (CBOT) exchange data, and industry intelligence from Farm Futures.
You will also discover how to trade Soybean futures with USDT using the integrated TradFi infrastructure on BingX.
Top 5 Things for Soybean Traders to Know in 2026
As Soybeans navigate a high-stakes battlefield of green energy mandates, macro credit tightening, and shifting international trade lanes, market participants must strictly monitor these five price-catalysts.
- The Biofuel Demand Anchor: Soybean oil has officially detached from traditional oilseed dynamics. U.S. domestic consumption for renewable diesel and biodiesel is projected to absorb a record 17.8 billion pounds of soy oil in 2026/27, providing a rigid structural price floor for the entire complex.
- The June 30 Acreage Showdown: The absolute near-term wildcard is the USDA’s upcoming June 30 planted acreage report. While current forecasts are modeled on 84.7 million acres, private consultancies warn that war-driven fertilizer spikes in early spring prompted a late shift out of corn, potentially boosting bean area by 1 to 2 million acres.
- South American Volume Dominance: Despite intense credit pressures and high interest rates, with the benchmark Selic rate sitting at nearly 15%, Brazil is executing a historic marketing year. The USDA holds the 2026 Brazilian soybean crop at a record 180 million metric tons, paired with a revised 50 MMT crop out of Argentina, flooding global export pipelines.
- The Energy De-escalation Drag: The structural unwinding of the Middle East conflict has untangled crucial shipping logistics in the Strait of Hormuz. A subsequent crude oil sell-off toward the pre-war $60s removes a massive secondary layer of speculative buying from competing vegetable oil markets.
- Expanding Market Carry: The forward curve for CBOT soybean futures is exhibiting a prominent widening premium. The spread between November 2026 and March 2027 futures has stretched out to 14 cents, signaling ample short-term physical availability while incentivizing storage hedging.
What Is Soybean (ZSX26)?
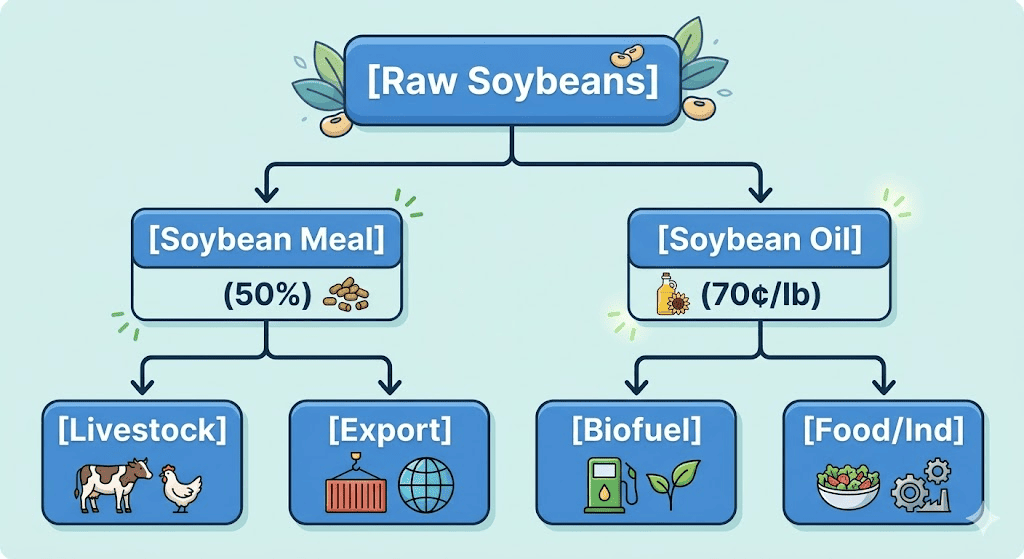
Soybeans represent the foundational layer of global agricultural oilseed trade, uniquely valued for their dual economic output. When raw beans undergo industrial processing via crushing, they yield two distinct, high-value commercial assets: Soybean Meal - a high-protein livestock feed baseline, and Soybean Oil - traditionally a food product, now heavily prioritized as a premium green fuel feedstock.
In 2026, the global economics of the bean are dictating highly inelastic domestic processing margins. Because the U.S. domestic crush capacity is expanding rapidly, local processors are aggressively competing for physical volume, even as global commodity markets face international export imbalances. Trading soybeans at the institutional level is primarily benchmarked via the CME Group’s Chicago Board of Trade (CBOT) standard 5,000-bushel futures contract, alongside dedicated agricultural real-world asset (RWA) vehicles like the Teucrium Soybean ETF (SOYB).
On the BingX TradFi platform, traders can directly capitalize on these major agricultural commodity price swings by utilizing the Soybean-USDT perpetual contract, providing seamless, leveraged exposure to international CBOT price action without requiring physical grain delivery infrastructure.
Soybean's Recent Market Performance: 2025 Downtrend to 2026 Volatility Spike
In 2025, the soybean complex operated under heavy macroeconomic pressure, with a 6-million-acre reduction dropping planted area to 81.2 million acres and driving local U.S. ending stocks up to 340 million bushels. This left average cash farm prices hovering in a muted range between $10.00 and $10.40 per bushel.
However, the structural landscape transformed dramatically during the first half of 2026. Geopolitical tensions across the Middle East triggered an explosive 60% macro vertical rally in CBOT soybean oil futures, surging from a January low of 48.28 cents up to a June peak of 79.69 cents per pound. This massive domestic demand pull drove new-crop November 2026 soybean futures into a persistent multi-month uptrend, briefly breaching the major $12.00 threshold in mid-May.
Soybean's 2026 Trading Strategy: Technical Levels to Watch
- The $11.00–$11.20 Structural Floor: Technical analysts identify the June 15 low of $11.21 and the March technical support at $11.18 as the critical line in the sand for macro bulls. A decisive break below this zone opens the door to a rapid test of the longer-term cyclical floor at $10.55.
- The $12.14–$12.38 Resistance Barrier: The March peak at $12.38 and the May 13 high at $12.14 form a formidable overhead resistance zone. Speculators must clear this technical shelf to open up a multi-month run toward the 2024 high of $12.58.
- Crush Margin Monitoring: Traders should not analyze raw bean prices in isolation. Tracking the Decatur processing spread (value of crude oil + 48% protein meal minus the cost of raw beans) is essential, as record domestic crush margins are keeping automated institutional buying algorithms highly active.
Soybean 2026 Price Prediction: $13.00 Biofuel Spike vs. $10.50 Record Harvest
Investors navigating the new-crop soybean market must carefully balance an unprecedented domestic green energy consumption boom against the reality of swelling international inventories.
The Bull Case: The $13.00 Green Energy Supply Squeeze
The bullish thesis, heavily backed by private asset managers tracking the Renewable Fuel Standard (RFS) mandates, relies on the intensifying structural squeeze inside the domestic crushing network. The June 2026 WASDE report officially confirmed that the U.S. soybean crush for the 2026/27 marketing year will hit a record-shattering 2.75 billion bushels. With domestic meal disappearance rising and soybean oil exports intentionally restricted to keep supplies domestic for biofuel production, the U.S. balance sheet is entering an exceptionally tight operational phase.
If the June 30 acreage survey reveals that the shift out of corn was heavily exaggerated, or if a sudden weather disruption hits the Midwest during the crucial August pod-filling phase, ending stocks will rapidly tighten below the current 310-million-bushel projection. In this scenario, intense processor demand will force cash basis premiums higher, driving speculative capital back into the market and fueling a rapid breakout past the $12.50 technical barrier toward an targets near $13.00.
The Base Case: $11.20 – $11.80 Balance Sheet Consolidation
The base-case scenario projects a highly volatile, range-bound market where aggressive domestic processing demand effectively blocks extreme price collapses, but massive international volume caps the upside. The official USDA season-average farm price forecast remains pinned at $11.40 per bushel for the 2026/27 marketing year, up exactly $1.00 from the previous year's average.
Under this framework, prices will continue to absorb the cooling of the geopolitical energy shock, balancing a projected U.S. yield of 53 bushels per acre against strong international demand. While China continues to aggressively purchase physical volumes from South America, recent flash sales of U.S. new-crop volume to unknown destinations highlight that international buyers will step in on deep value pullbacks. Strategic positioning in this environment involves range-trading the intermediate fluctuations, tracking weekly export sales data, and prioritizing short-term scalp setups between the structural $11.10 support and $12.00 resistance.
The Bear Case: The $10.50 Supply Glut and Acreage Trap
The bearish narrative, warned by veteran grain analysts at BMO and Farm Futures, centers on a double-barreled supply shock where global production completely outpaces industrial capacity. If the June 30 Acreage report confirms that high nitrogen fertilizer costs forced a major shift into low-input oilseeds, U.S. planted soybean area could easily spike past 86 million acres. Combined with favorable weather and trendline yields, production would completely shatter the historic 2021 record, swelling ending stocks far past the 350-million-bushel mark.
This domestic supply build would happen exactly as South American volume peaks. With Argentina's current crop revised up to 50 million metric tons and Brazil's logistical port infrastructure continuing to dump record volumes into global channels, the global soybean ending stocks are set to scale up to 124.9 million metric tons. If a daily close below $11.10 triggers massive managed-money liquidation, the price floor will rapidly drop to test the $10.50 support level, returning the crop to its marginal cost of production.
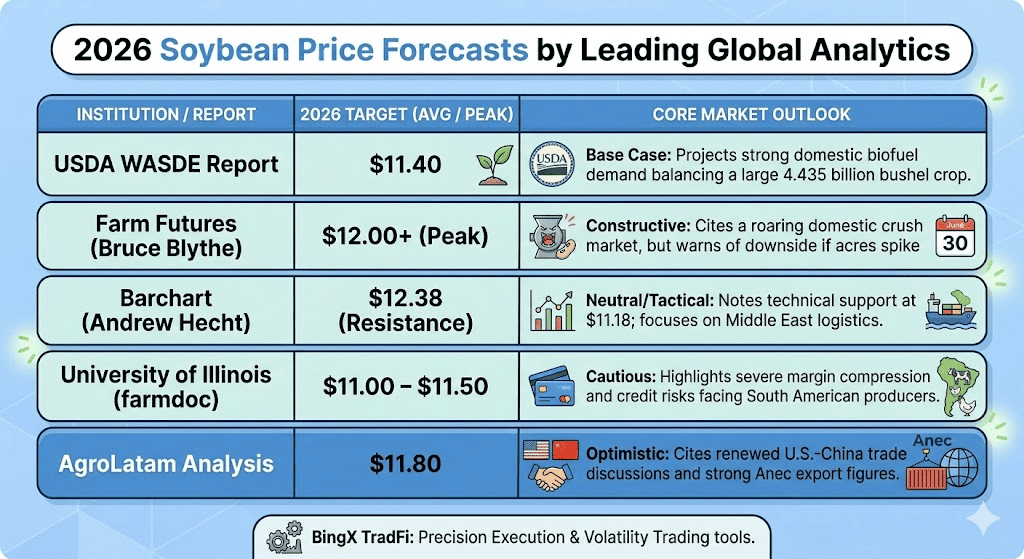
Soybean Price Forecasts for 2026 by Leading Global Analytics
|
Institution / Report |
2026 Target (Avg / Peak) |
Core Market Outlook |
|
USDA WASDE Report |
$11.40 |
Base Case: Projects strong domestic biofuel demand balancing a large 4.435 billion bushel crop. |
|
Farm Futures (Bruce Blythe) |
$12.00+ (Peak) |
Constructive: Cites a roaring domestic crush market, but warns of downside if acres spike June 30. |
|
Barchart (Andrew Hecht) |
$12.38 (Resistance) |
Neutral/Tactical: Notes technical support at $11.18; focuses on Middle East logistics. |
|
University of Illinois (farmdoc) |
$11.00 – $11.50 |
Cautious: Highlights severe margin compression and credit risks facing South American producers. |
|
AgroLatam Analysis |
$11.80 |
Optimistic: Cites renewed U.S.-China trade discussions and strong Anec export figures. |
How to Trade Soybean Futures on BingX TradFi
Whether you are looking to hedge downstream agricultural input costs or tactically trade the high-impact summer weather cycles, the BingX platform gives you the direct technical tools required for precision commodity execution.
- Access BingX TradFi: Log into your trading terminal, navigate to the Markets dashboard, and select the TradFi/Commodities module.
- Select the Instrument: Choose the Soybeans-USDT Perpetual contract to open the real-time charting environment.
- Execute Market Sentiment Strategy: Select Open Long if your fundamental analysis projects a tight June 30 acreage count and high biofuel demand, or choose Open Short to trade the record-crop bear case.
- Deploy Strict Risk Management: Utilize the integrated BingX advanced Take-Profit and Stop-Loss (TP/SL) brackets to actively shield your capital balance against sharp, sudden macro movements during volatile weekly USDA supply releases.
Top 5 Risks to Watch for Soybean Traders in 2026
While the long-term biofuel structural demand story remains historically supportive, market participants must carefully navigate five critical supply, weather, and policy milestones that could trigger rapid downside volatility.
- Acreage Surges: A massive surprise upward revision in the June 30 acreage survey will immediately trigger algorithmic fund selling.
- El Niño Climate Flips: Weather patterns must be watched closely; if an unexpected cooling cycle drops optimal summer precipitation across the Midwest, yields will rapidly fall below the projected 53 bpa.
- Brazilian Delinquency Levels: Nearly 20% of farm loans in Brazil are currently classed under bad debt. A sudden wave of farm seizures could cause credit disruption, impacting next season's inputs.
- EPA Policy Reversals: Any legislative adjustments or corporate waivers granted under the current Renewable Fuel Standard parameters would immediately smash the domestic soy oil premium.
- Chinese Import Pivots: If economic growth slowdowns force China to heavily restrict international grain imports, massive un-exported volumes will instantly back up into Western ports.
Is Soybean a Good Investment in 2026?
As of mid-June 2026, soybeans occupy a unique structural position that balances a highly resilient domestic demand profile against a rapidly growing global supply buffer. For tactical investors, the market presents a classic volumetric tug-of-war: the accelerating domestic biofuel mandates and record-breaking U.S. crush processing speeds establish a reliable structural price floor, yet the overarching reality of record South American harvests and impending U.S. acreage expansions fundamentally limits runaway upside potential. Consequently, determining whether soybeans represent an optimal allocation relies heavily on an investor's time horizon and capacity to manage sudden policy and climate-driven price swings.
Practical participation in this high-volatility environment requires shifting away from chasing long-term macro trends toward executing highly disciplined, data-driven range trading. Market participants should actively prioritize tracking key localized metrics, specifically Western physical delivery premiums and shifting domestic crush margins, rather than relying solely on global exchange headlines. Utilizing advanced risk management tools, such as the precision Perpetual contracts and automated stop-loss frameworks available on BingX TradFi, allows traders to efficiently trade the fluctuations between defined structural supports and overhead resistance barriers without overexposing capital to unpredictable regulatory updates or sudden summer weather shifts.
Risk Reminder: Trading global agricultural commodities involves extreme capital exposure due to intense climate dependency, currency fluctuations, and macro policy changes. Soybeans are prone to large gap moves over weekend news breaks and during the 12:00 PM CST daily cash settlement windows. Always ensure proper risk allocation and utilize strict margin parameters.
Related Reading
- Sugar Global Outlook 2026: Biofuel Squeezes, Monsoon Rebounds, and the Fight for Global Supply
- Wheat Global Outlook 2026: Balancing Regional Weather Shocks vs. Abundant Black Sea Supply
- Crude Oil Price Forecast 2026: $140 War Premium or $60 Surplus Baseline?
- Is Copper (XCU) a Good Investment in 2026?
- How to Trade Commodities With Crypto in 2026 as Oil, Gold, Silver, and TradFi Go On-Chain
