
Taiwan Semiconductor Manufacturing Company (TSMC) manufactures chips designed by customers across smartphones, AI computing and networking. Leading-edge nodes and advanced packaging are central to its growth, while overseas fabs broaden manufacturing capacity. New-process yields, customer utilization and the cost of foreign expansion determine whether rising AI orders earn enough to justify a historically large capital program.
The latest quarter showed two-nanometer production gaining scale while margins absorbed ramp costs. TSMC Q3 U.S.-dollar revenue reached $46.72 billion, up 41.2% year over year, and N2 rose to 8% of wafer revenue. Diluted earnings were $4.60 per U.S. ADR, but gross margin fell from Q2 to 66.4%. The Q4 test is whether greater volume offsets new-node and overseas-fab costs.
The TSM stock forecast for 2026 now centers on two competing views:
- The advanced-node demand case: AI accelerators, 2-nanometer production and a stronger Q4 revenue guide can sustain premium earnings as new capacity comes online.
- The capital-intensity case: Overseas factories, node ramp costs and a $60 billion to $64 billion capital budget can dilute returns if customer spending or utilization weakens.
This guide breaks down the TSM stock forecast, 2026 price scenarios, key risks and analyst outlooks, drawing on TSMC’s October 15 Q3 earnings release, investor presentation, call transcript and market data through October 19, plus how to buy TSM stock on BingX TradFi with USDT.
Top 5 Things for TSMC Investors to Know in October 2026
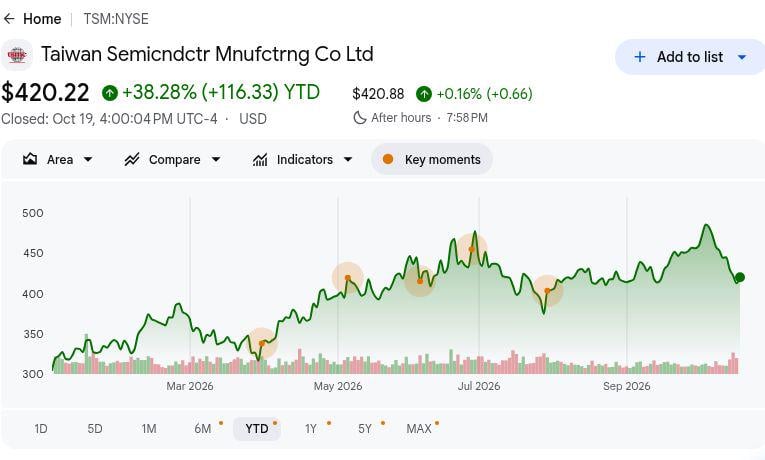
- TSM closed at $420.22, up 38.28% year to date. The October 19 NYSE ADR close gained $7.61 on the day and sits below Barclays’ $670 post-Q3 target. That year-to-date gain reflects AI optimism, making earnings and margin delivery more important than an analyst-target comparison.
- Q3 USD revenue of $46.72 billion beat company guidance. The result exceeded the $45.8 billion ceiling by $0.92 billion and grew 41.2% year over year in dollars. That scale confirms robust leading-edge demand, although the 50.9% growth reported in local currency is different because exchange rates changed. That distinction matters when modeling the ADR.
- The 2-nanometer share climbed to 8% of wafer sales. N2 had been 3% of wafer revenue in Q2; 7-nanometer and below together reached 79% in Q3. N2 supports future pricing, but ramp costs helped pull gross margin down 1.3 points to 66.4%.
- Q4 revenue guidance reaches $54.3 billion at the top. The $52.3 billion to $54.3 billion range implies roughly 14% sequential growth at its midpoint from Q3. Management also projected around 44% full-year USD revenue growth. Guided 65% to 67% gross margin tests ramp economics.
- A $60 billion to $64 billion capital budget raises the return test. Management reiterated that 2026 plan and expects N2 family capacity to more than double in 2027. Overseas fabs are expected to dilute 2026 gross margin by around two points, widening toward three to four points in later years. Sustained orders must justify its scale.
What Is Taiwan Semiconductor Manufacturing Company (TSM)?
Taiwan Semiconductor Manufacturing Company (TSMC) is the world's leading semiconductor foundry, manufacturing advanced chips designed by companies such as Apple, NVIDIA, and AMD. Founded in 1987, TSMC pioneered the pure-play foundry model, focusing on chip production rather than developing competing processor designs. Its manufacturing technologies and advanced packaging services support smartphones, AI accelerators, high-performance computing, automotive electronics, and connected devices. In 2025, TSMC manufactured 12,682 products for 534 customers using 305 process technologies, with revenue growth driven by production volume, advanced-node demand, and manufacturing efficiency.
TSMC is expanding its next-generation 2nm (N2) manufacturing capacity in Taiwan, with annual N2-family capacity expected to more than double in 2027. Its A14 process is scheduled for risk production in 2027 and volume production in 2028, while a second Arizona fabrication plant is targeting production in Q3 2027. The company's CoWoS advanced packaging technology also plays a critical role in connecting AI processors with high-bandwidth memory (HBM). These investments strengthen TSMC's position across the AI hardware supply chain, with future growth tied to customer demand, production yields, and timely capacity expansion. The semiconductor manufacturing supply-chain guide explains its role in advanced chip production.
Read More: Top 10 AI Hardware Stocks to Watch in 2026: The Architecture Driving Next-Gen Intelligence
TSMC (TSM) Q3 2026 Earnings Overview: Strong AI Demand Drives Revenue Beat and Higher Guidance
TSMC reported Q3 2026 revenue of $46.72 billion, up 41.2% year over year and $0.92 billion above its guidance ceiling. Diluted EPS reached $4.60 per ADR, beating the $4.46 consensus estimate, while advanced-node technologies contributed 79% of wafer revenue and 2nm (N2) reached 8%. Gross margin remained strong at 66.4%, although N2 ramp-up and overseas manufacturing costs weighed on profitability. Q4 revenue guidance of $52.3 billion to $54.3 billion signals continued growth, with manufacturing efficiency central to sustaining margins.
|
Financial Metric |
Guidance / Consensus |
Reported / Actual |
Surprise |
|
Q3 USD revenue |
44.6B–45.8B guidance |
$46.72B |
Beat. $0.92B above guide ceiling; up 41.2% YoY. |
|
Q3 diluted EPS/ADR |
$4.46 FactSet consensus |
$4.60 |
Beat. $0.14 above consensus. |
|
Q3 advanced-node mix |
77% in Q2 |
79% of wafer revenue |
Expanded. Up 2 percentage points sequentially. |
|
Q3 N2 wafer mix |
3% in Q2 |
8% of wafer revenue |
Expanded. Up 5 percentage points sequentially. |
|
Q3 gross margin |
65%–67% guidance |
66.40% |
Within. Down 1.3 points from Q2. |
|
Q3 operating margin |
56%–58% guidance |
58.70% |
Above. 0.7 point over guide ceiling. |
|
Q4 USD revenue outlook |
$46.72B Q3 actual |
52.3B–54.3B |
Higher. Midpoint implies 14.1% sequential growth. |
- USD revenue of $46.72 billion cleared the guide by $0.92 billion. Growth of 41.2% from a year earlier and 16.2% from Q2 shows demand accelerated across reporting bases. Strong leading-edge orders carried shipments beyond plan. New capacity must convert that volume into returns.
- ADR earnings of $4.60 beat the tracked estimate by $0.14. The FactSet estimate cited by Investor’s Business Daily was $4.46, while TSMC reported 68.7% year-over-year earnings growth in its reporting currency. That supports operating leverage, though N2 startup costs may alter it.
- N2 increased from 3% to 8% of wafer revenue. N3 added 33% and N5 another 28%, taking 7-nanometer and below to 79% of Q3 wafer sales. The five-point N2 mix rise shows real output; yield and pricing remain margin tests.
- Gross margin fell 1.3 points to 66.4%. It remained inside the 65% to 67% Q3 guide, while 58.7% operating margin exceeded the 58% guide ceiling. N2 ramp dilution explains the margin contrast; higher volume must absorb those costs.
- Q4 guidance centers on $53.3 billion of revenue. That midpoint implies about 14.1% sequential growth, while guided gross margin remains 65% to 67% and full-year USD revenue is expected to rise around 44%. Roughly two points of overseas dilution makes expansion returns the test.
TSMC (TSM) 2026 Investment Outlook: $600 Bull Case vs. $350 Bear Case
TSMC's 2026 outlook depends on whether strong AI chip demand and growing 2nm (N2) adoption can sustain revenue growth and high profit margins. Q4 guidance points to another significant sales increase, while the $60 billion to $64 billion capital expenditure budget makes manufacturing efficiency, capacity utilization, and overseas expansion costs central to future returns.
The Bull Case: Strong N2 Demand Pushes TSM Toward $600
The Bull Case assumes Q4 revenue approaches or exceeds the $54.3 billion guidance ceiling as AI accelerators, networking chips, and premium smartphones drive advanced-node demand. N2 expands beyond its Q3 contribution of 8% of wafer revenue, while improving production yields offset startup costs. Gross margin near 67% would strengthen earnings despite heavy investment in new factories.
A move toward $600 per ADR would require stronger Q4 sales, sustained margins, and firm 2027 N2 customer commitments supporting planned capacity expansion. Higher production efficiency and continued AI demand would reinforce the upside, while weaker margins could limit valuation gains.
The Base Case: Steady Chip Demand Keeps TSM Between $430 and $500
The Base Case assumes Q4 revenue remains within management's $52.3 billion to $54.3 billion guidance as AI and advanced-node demand continue growing. N2 adoption expands, but startup expenses and overseas manufacturing costs keep gross margin within the guided 65% to 67% range. Heavy capital spending also moderates near-term cash generation.
TSM could trade between $430 and $500 per ADR if Q4 sales meet guidance, gross margin stays above 65%, and operating profitability remains strong. Improving N2 yields would support the upper end, while slower orders or higher overseas costs could pressure the range.
The Bear Case: Rising Manufacturing Costs Pull TSM Toward $350
The Bear Case assumes AI customers slow capacity commitments while consumer electronics demand weakens. N2 startup expenses and overseas factory costs could rise faster than utilization, pushing gross margin below the 65% Q4 guidance floor. The $60 billion to $64 billion capital expenditure program would then place greater pressure on cash flow and investment returns.
A move toward $350 per ADR would become more likely if Q4 revenue falls below $52.3 billion, management lowers its 2027 demand outlook, or overseas manufacturing costs rise faster than expected. Weaker margins and slower capacity utilization could further pressure valuation.
TSM Stock Price Forecasts for 2026 By Wall Street Analysts
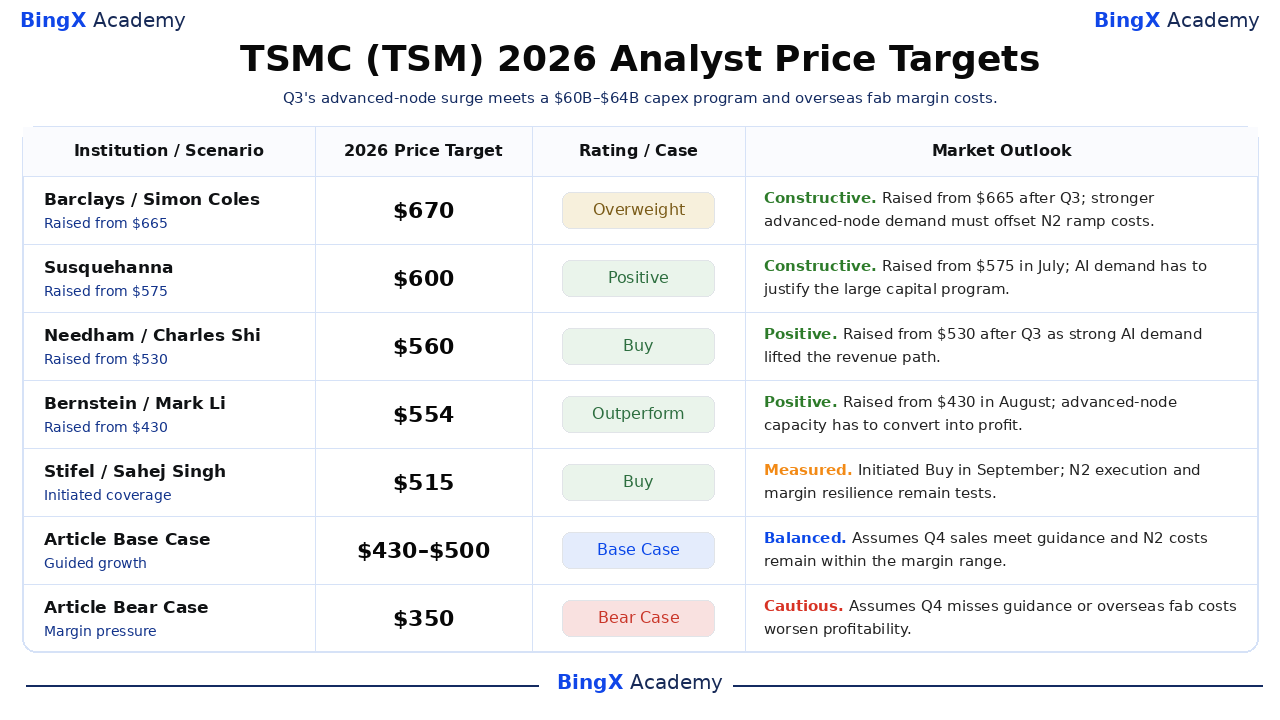
These named, dated third-party targets refer to the U.S. TSM ADR and usually span a roughly 12-month analyst horizon, so they should not be mistaken for guaranteed December 2026 prices. The spread from $515 to $670 reflects different assumptions about AI demand, wafer pricing and capacity costs. The final two rows are editorial 2026 cases.
|
Institution / Scenario |
2026 Price Target |
Rating / Case |
Market Outlook |
|
Barclays |
$670 |
Overweight |
Constructive. October 16: Raised from $665 to $670 after Q3; editorial view: stronger leading-edge demand supports earnings, subject to N2 margin costs. |
|
Susquehanna |
$600 |
Positive |
Constructive. July 16: Raised from $575 to $600 in July; editorial view: durable AI orders matter as capex remains 60B–64B. |
|
Needham |
$560 |
Buy |
Positive. October 15: Raised from $530 to $560 on Q3 results; strong AI growth was cited in post-earnings coverage. |
|
Bernstein |
$554 |
Outperform |
Positive. August 11: Raised from $430 to $554 in August; editorial view: the target needs advanced-node output and pricing to convert into profit. |
|
Stifel |
$515 |
Buy |
Measured. September 2: Initiated Buy with a $515 target; editorial view: N2 execution and margin resilience must support the premium. |
|
Article Base Case |
430–500 |
Base Case |
Balanced. Assumes Q4 sales meet guidance and N2 costs remain within the margin range. |
|
Article Bear Case |
$350 |
Bear Case |
Cautious. Assumes Q4 misses guidance or overseas fab costs worsen profitability. |
How to Buy TSMC (TSM) Stock on BingX
Buy and hold TSMC shares through BingX Stocks Trading using USDT or USDC. TSMC offers exposure to AI chip demand, advanced semiconductor manufacturing, and its expanding 2nm (N2) production capacity. With fractional investing and no leverage or funding fees, eligible users can build positions based on their investment goals and outlook for TSMC's long-term growth.
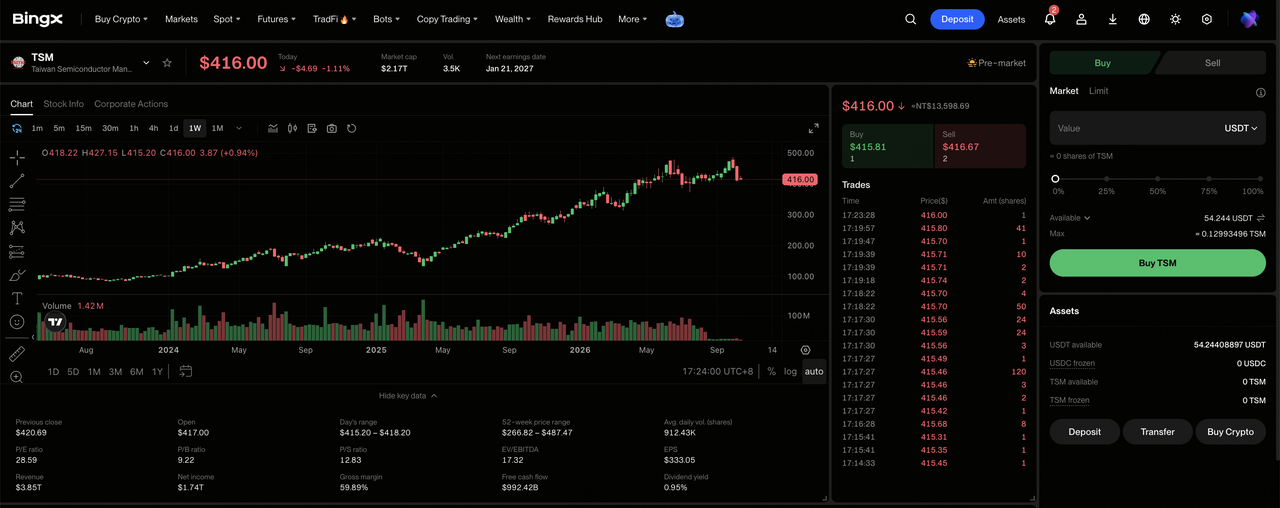
Step 1: Access BingX Stocks Trading. Sign up or log in to BingX, complete the required identity verification, and navigate to "TradFi > Stocks". Accept the Stock Trading Risk Disclosure if accessing the product for the first time.
Step 2: Prepare USDT or USDC. Ensure your Spot Account has sufficient funds for the purchase. Transfer USDT or USDC from your Fund or Wealth Account if needed. Fractional purchases start from 5 USDC or 0.0001 shares.
Step 3: Select TSMC (TSM). Open the Stocks market, search for TSM, and select Taiwan Semiconductor Manufacturing Company (TSM). Review the current share price, trading session, and available order types.
Step 4: Buy TSMC Shares. Select "Buy", enter the investment amount or share quantity, and choose a market or limit order. Market orders execute at available prices during supported trading hours, while limit orders execute at the specified price or better when sufficient liquidity is available.
Step 5: Review and Manage Your Holdings. Open "Stocks > Positions" to monitor your TSM shares and unrealized profit or loss. Use All Orders to review transactions or sell shares when needed. T+1 settlement generally affects when sale proceeds become available for withdrawal, rather than when shares can be sold.
Top 5 Risks to Watch for TSMC Investors in 2026
TSMC’s leading process position does not remove the financial and operating risks of scaling new nodes and fabs. Each can change expected cash returns or the valuation assigned to the U.S. ADR.
- Capital spending can outrun customer demand. The $60 billion to $64 billion 2026 budget commits cash ahead of future wafer sales. If AI orders or fab utilization disappoint, depreciation and lower free cash flow can reduce earnings per ADR and the price investors will pay for expected growth.
- Overseas factories can dilute gross margin. Management expects about two points of dilution in 2026 and three to four points in later years. If those costs arrive before premium pricing and volume, incremental revenue converts into less profit, lowering the return on invested capital.
- N2 yield and mix changes can squeeze returns. N2 already contributed 8% of Q3 wafer sales as gross margin fell 1.3 points sequentially. A slow yield ramp or larger startup costs could prevent higher advanced-node sales from delivering proportionate earnings growth.
- Consumer weakness can undercut the AI mix. Management flagged price-sensitive markets and rising component costs in its October call. A handset or PC slowdown can reduce fab utilization outside AI, leaving fixed manufacturing expenses spread across fewer wafers and pressuring per-share profit.
- Policy and geographic concentration can disrupt production. Advanced manufacturing still depends heavily on Taiwan, despite Arizona and Japan expansion. Cross-strait tension, export restrictions or supply interruptions could delay deliveries, require costly redundancy and raise the discount investors apply to future cash flow.
Final Thoughts: Should You Invest in TSMC in 2026?
TSMC entered the final quarter with a rare combination of 41.2% dollar revenue growth, 79% advanced-node wafer mix and a Q4 revenue range beginning at $52.3 billion. N2 has moved from development to meaningful production, and AI demand gives the foundry an unusually strong order backdrop. Its leadership requires exceptional spending.
The $600 bull case depends on N2 scale reaching earnings while Q4 gross margin holds near 67%; the $350 bear case assumes orders or yield cannot carry overseas and start-up costs. The $430 to $500 base range assumes guided sales and ramp costs. Conservative traders can await Q4 revenue, gross margin and 2027 capacity evidence.
Risk Reminder: Trading and investing in equities like TSM involves a high risk of capital loss. Fab construction, process yield, policy changes, Taiwan concentration and shifts in AI spending can cause substantial volatility. Conduct independent research before allocating capital.
Related Reading
- What Is BingX Stocks Trading? A Beginner's Guide to Trading U.S. Stocks and ETFs With Crypto
- Top AI Chip Manufacturing Stocks to Buy in 2026: TSMC, ASML, and Advanced Chipmaking
- Top AI Semiconductor Stocks to Buy in 2026: AI Chips and Supply Chain Complete Guide
- NVIDIA (NVDA) Price Prediction 2026: Can AI Infrastructure Growth Drive NVDA Toward $420?
- ASML Holding (ASML) Price Prediction 2026: Can EUV Demand Push ASML Toward $2,500?
