
In today’s fast-moving financial world, crypto has become more than just a speculative asset; it’s now a potential hedge against inflation amid global uncertainties. As traditional investors look beyond Gold and the US Dollar, cryptocurrency trading is gaining serious traction, especially during periods of rising market volatility.
But crypto isn’t without risk. Digital assets can swing sharply in minutes. That’s why traders rely on technical indicators like Bollinger Bands to make smarter, more confident decisions.
Bollinger Bands are designed to track price volatility, spot potential trend reversals, and highlight overbought or oversold conditions. Whether you’re navigating Bitcoin, Ethereum, or altcoins, understanding how these bands work can help you time your entry and exit points more precisely.
In this guide, we’ll explain what Bollinger Bands are and how they’re calculated. You’ll learn how to read the upper and lower bands, along with real-world crypto trading strategies using the Bollinger Band squeeze, volatility expansion, and trend continuation setups.
If you're trading on BingX, this guide will show you how to apply Bollinger Bands on a price chart, combine them with other technical indicators, and anticipate potential price breakouts with greater confidence.
Let’s dive in.
What Are Bollinger Bands?
Bollinger Bands, often abbreviated as BBs, are a widely used technical analysis tool developed by John Bollinger in the early 1980s. While initially designed for traditional markets like stocks and commodities, Bollinger Bands are now equally valuable in cryptocurrency trading, where price swings and market volatility are often extreme.
At their core, Bollinger Bands are used to measure how volatile a market is, whether it’s Bitcoin, Ethereum, or an altcoin on BingX. They help traders assess price movements relative to historical patterns and spot potential reversals, breakouts, or oversold conditions.
The indicator is made up of three lines:
• The middle band, which is a simple moving average (SMA), typically over a 20-period range
• The upper band, which is two standard deviations above the SMA
• The lower band, which is two standard deviations below the SMA
Because the standard deviation expands and contracts in response to price fluctuations, the bands widen during volatile periods and tighten when volatility decreases. This dynamic visual helps traders anticipate key shifts in market dynamics.
In short, Bollinger Bands help traders visualize when crypto prices are relatively high or low, offering a framework for smarter entry and exit points based on how prices interact with the bands.
Structure of Bollinger Bands
The Bollinger Bands indicator consists of three lines that form a dynamic price channel based on historical volatility. These lines adapt as market conditions change, making them a powerful tool for analyzing crypto price movements.
Here’s how they’re calculated:
1. The middle band is a Simple Moving Average (SMA) of the closing price over a set number of periods (typically 20).
2. The upper band is calculated as: SMA + (k × Standard Deviation)
3. The lower band is calculated as: SMA - (k × Standard Deviation)
This structure creates a visual envelope that expands and contracts with market volatility. When the market becomes more volatile, the bands widen. During low volatility, the bands contract, forming what's known as a Bollinger Band squeeze, often a precursor to potential price breakouts.
By default:
• N = 20 (the lookback period)
• k = 2 (multiplier for standard deviation)
However, traders on platforms like BingX can adjust these settings to fit their strategy. Some may choose to replace the SMA with an Exponential Moving Average (EMA) for more sensitivity to recent price changes.
When plotted on a crypto price chart, Bollinger Bands form a flexible trading channel that helps you identify whether a coin is relatively overbought or oversold, and if a major move might be coming.
Understanding the Upper, Lower, and Middle Bands
To use Bollinger Bands effectively in crypto trading, it’s important to understand the role of each band and how they interact with price movements.
• The middle band is the Simple Moving Average (SMA) of the past 20 closing prices. It reflects the average price trend and acts as a short-term trend baseline.
• The upper band is placed two standard deviations above the SMA. It marks the upper limit of typical price movement.
• The lower band is placed two standard deviations below the SMA. It identifies the lower limit of expected price action.
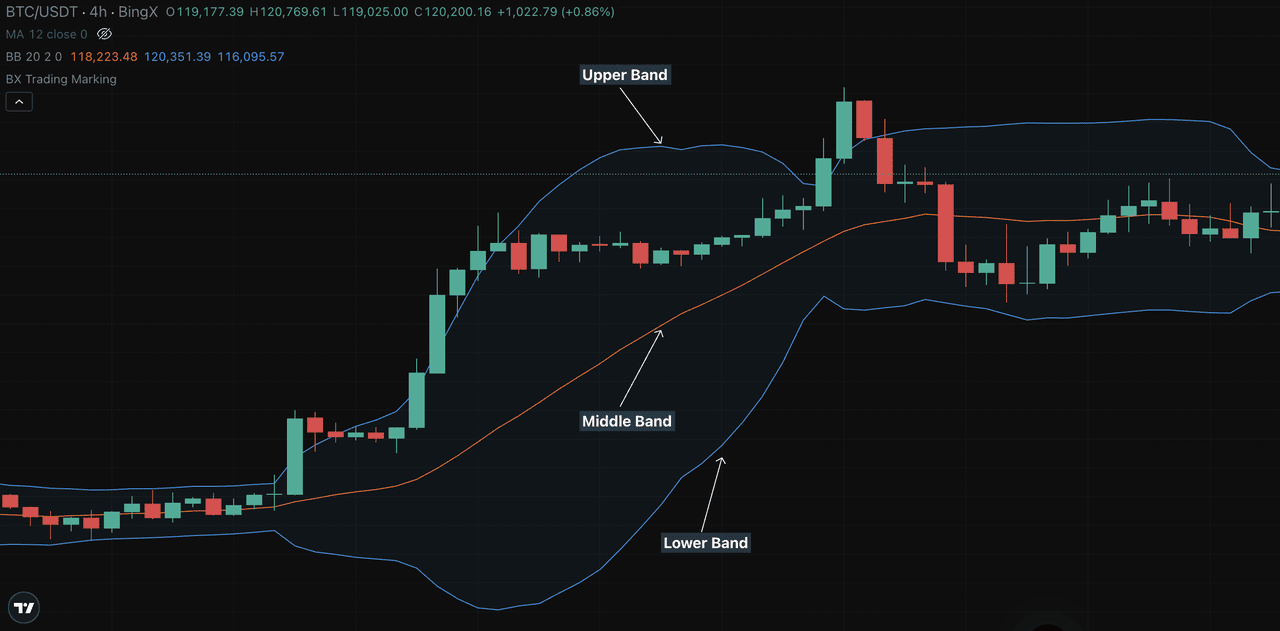
Source: BTC/USDT on BingX spot market
When price volatility increases, the bands widen, a sign that large moves are underway. When volatility drops, the bands contract, forming a tighter channel often associated with consolidation or a Bollinger Band squeeze.
Here’s how traders interpret band interactions:
1. When a crypto asset’s price hits or breaks above the upper band, it could signal overbought conditions, but not always a reversal. Strong trends often ride the upper band.
2. If price falls to or below the lower band, it may suggest oversold conditions. But again, it could also signal trend continuation in a downtrend.
3. When prices bounce between the upper and lower bands, the market is likely range-bound. This helps traders identify support and resistance levels.
4. A sustained move above the middle line often suggests a bullish trend. If price consistently holds above this line and taps the upper Bollinger Band, it’s seen as a healthy uptrend.
5. When both bands tighten for an extended period, it’s often a sign that a volatility breakout is imminent—traders watch closely for price to break in either direction.
While Bollinger Bands offer powerful insights, they don’t predict direction on their own. Differentiating between trend continuation and trend reversal requires experience, especially when combined with other technical indicators like the Relative Strength Index (RSI) or volume analysis.
How to Apply the Bollinger Bands Indicator on BingX
Using Bollinger Bands on your crypto price chart is easy with the TradingView interface built into the BingX platform. Here’s how to set it up:
Step 1: Open your desired crypto trading pair (like BTC/USDT or ETH/USDT) on BingX, and tap the chart to open the full-screen view.
Step 2: Click on the Indicators button at the top of the chart.
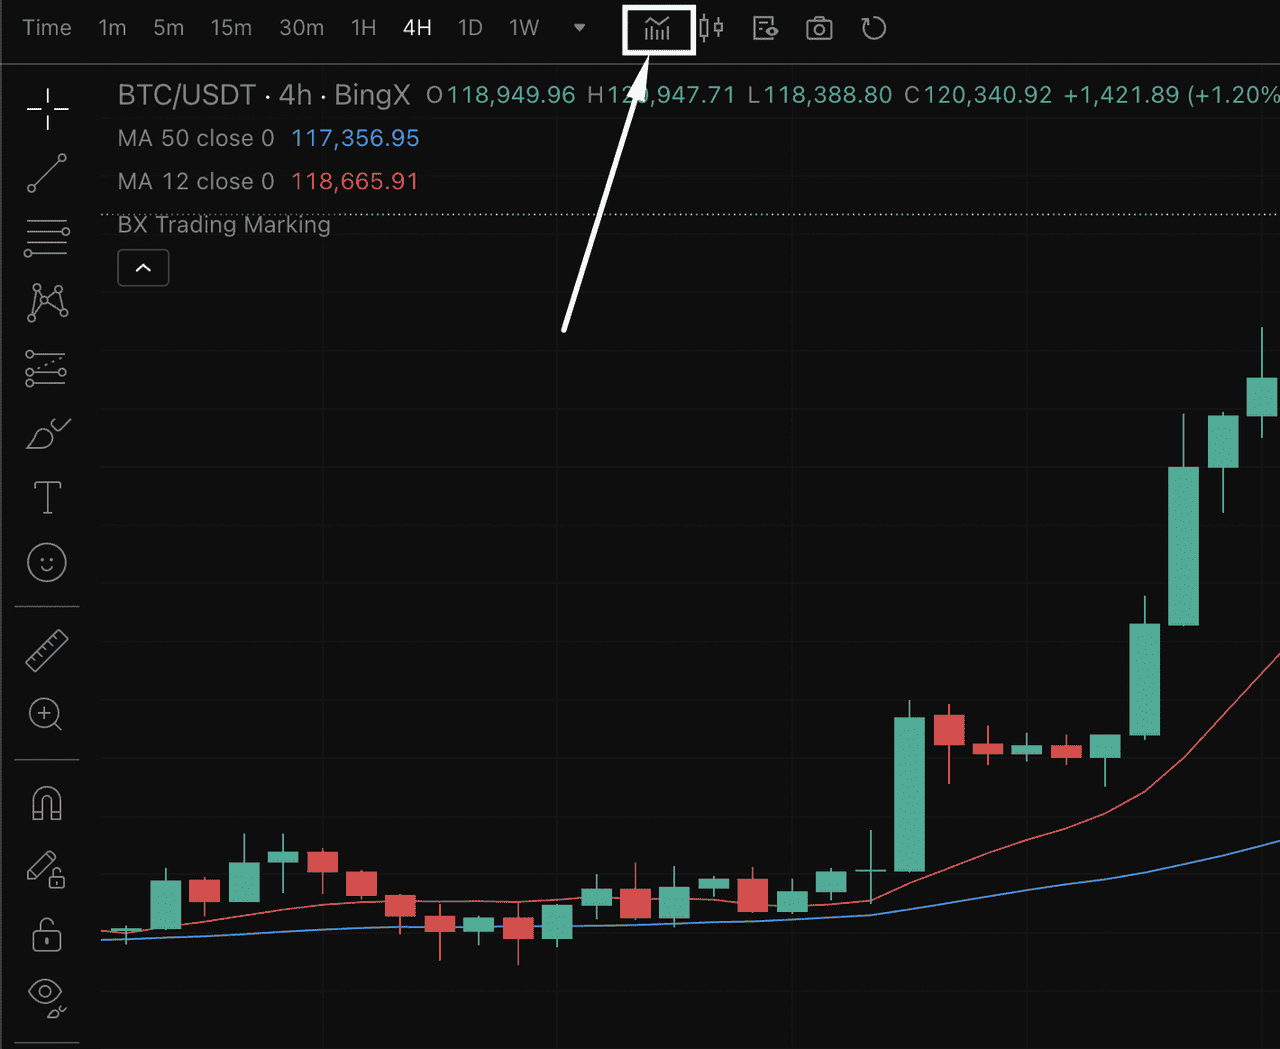
Source: BTC/USDT on BingX spot market
Step 3: Type "Bollinger Bands" into the search bar. The indicator will appear in the list.
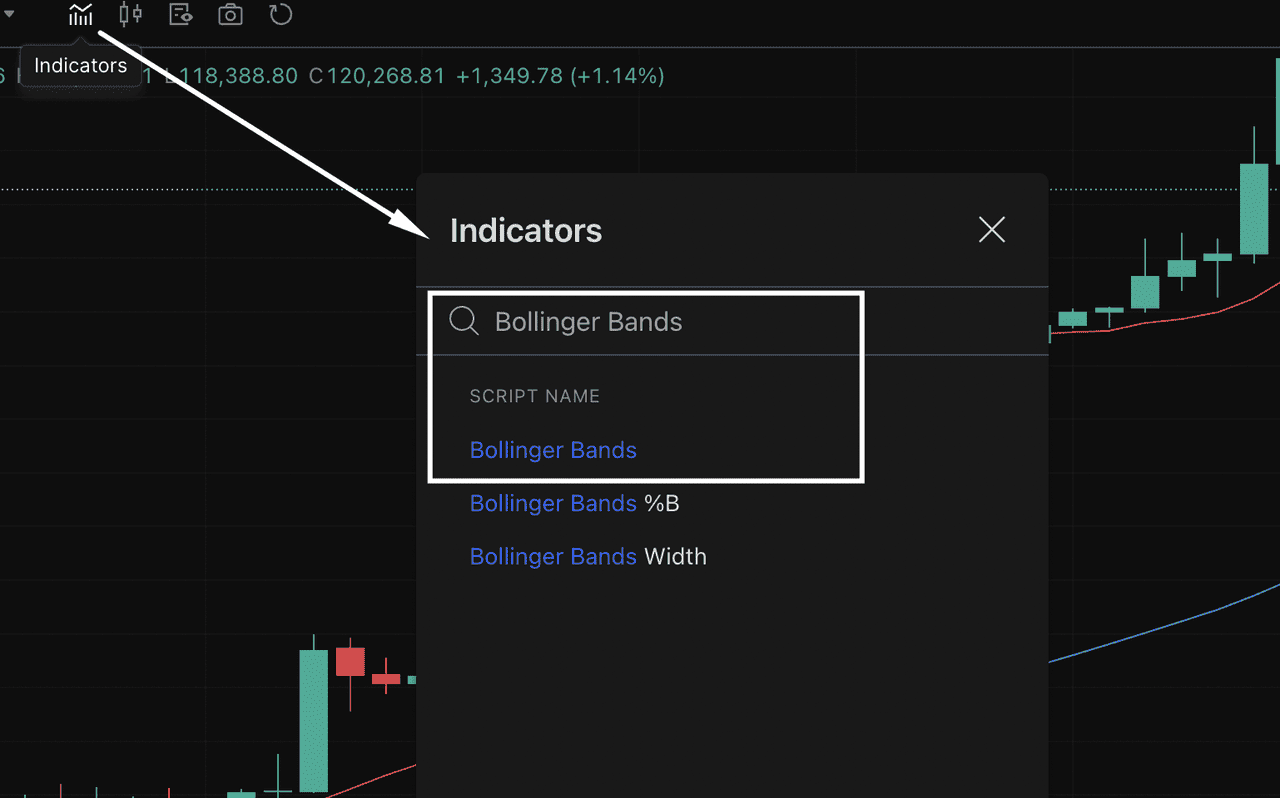
Source: BTC/USDT on BingX spot market
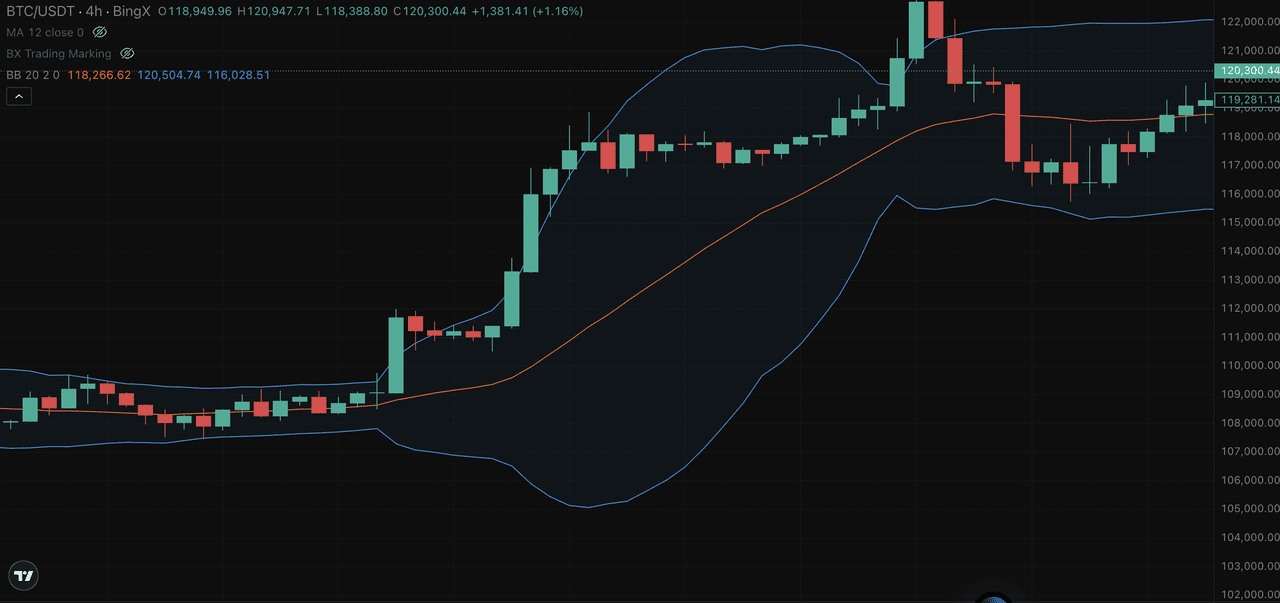
Step 4: Click on Bollinger Bands to apply it instantly to your chart. You'll now see the upper band, lower band, and middle band (simple moving average) displayed over the price action.
Source: BTC/USDT on BingX spot market
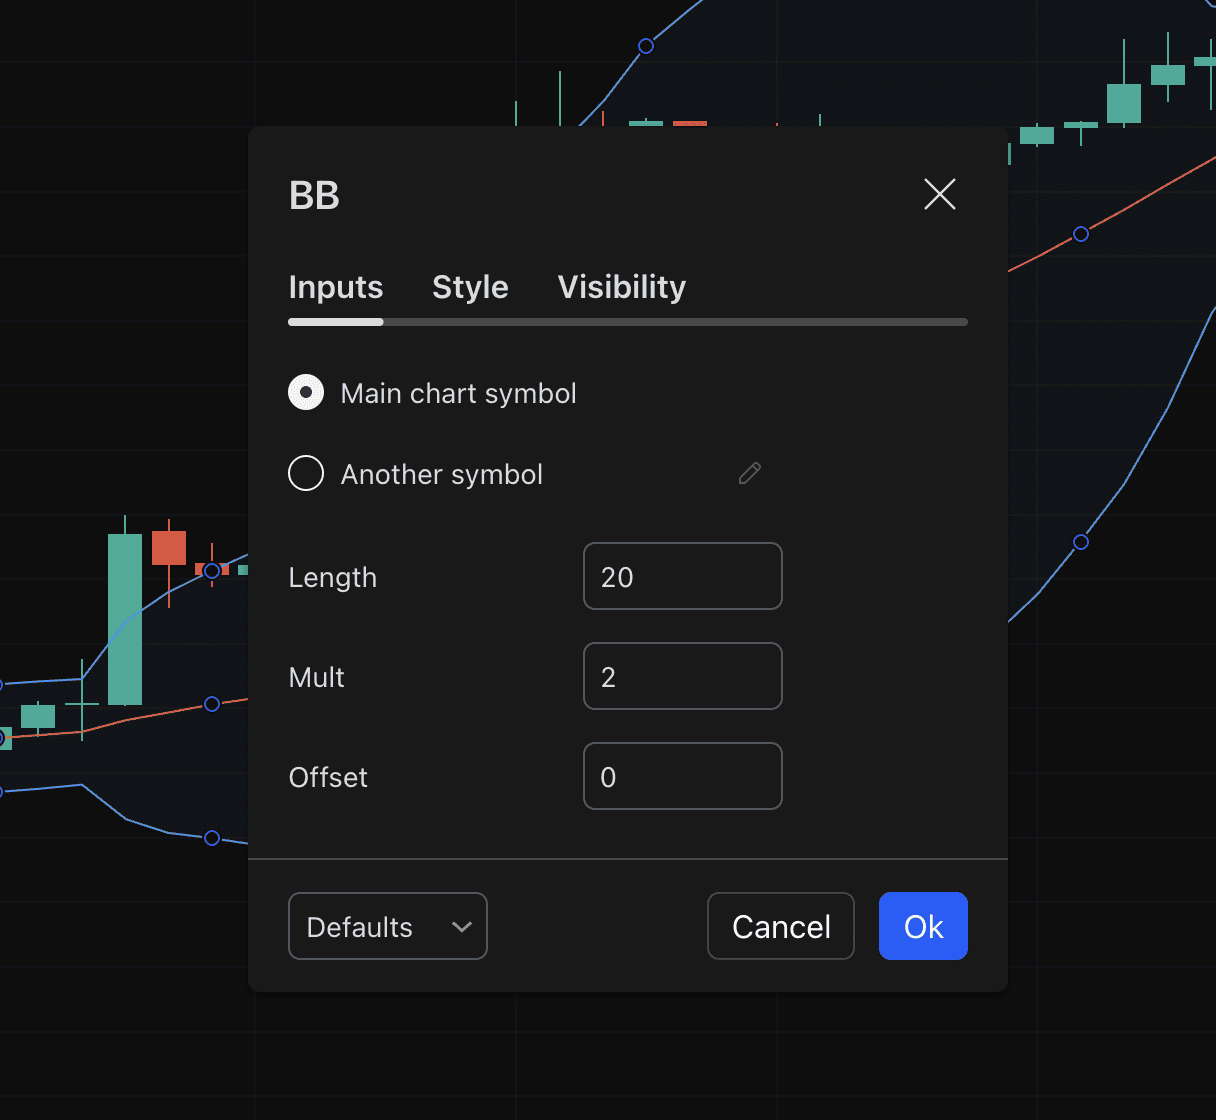
From here, you can customize Bollinger Bands settings like the length (default is 20) and standard deviation (default is 2) to match your trading strategy or market conditions.
Source: BTC/USDT on BingX spot market
This tool helps you visually track price volatility, identify potential entry and exit points, and prepare for significant price movements.
How to Adjust Bollinger Band Settings for Different Trading Styles
The way you set up Bollinger Bands should align with your trading approach. Whether you're trading short-term volatility or holding long-term positions, adjusting the moving average period and standard deviation values can improve your results.
Here’s how different types of crypto traders typically configure their Bollinger Bands:
• Short-Term Traders (Scalping or Intraday): Use a 10-period SMA with bands set at 1.5 standard deviations. This setup offers quicker signals and reacts more sharply to price changes, ideal for fast-moving crypto pairs.
• Medium-Term Traders (Swing Traders): Stick with the default 20-period SMA and 2 standard deviations. This balanced configuration is well-suited for analyzing price volatility and trend shifts over several days.
• Long-Term Traders (Position Holders): Use a 50-period SMA and increase the deviation to 2.5. This smooths out short-term noise and helps identify broader market trends in volatile assets like BTC or ETH.
You can easily modify these parameters within the indicator settings on BingX’s charting tools. Tuning the bands allows you to match your strategy to market conditions, whether you're tracking a quiet consolidation phase or anticipating a large price breakout.
Bollinger Bounce Strategy for Range-Bound Crypto Markets
One practical way to use Bollinger Bands in crypto trading is the Bollinger Bounce, a strategy designed for markets moving sideways.
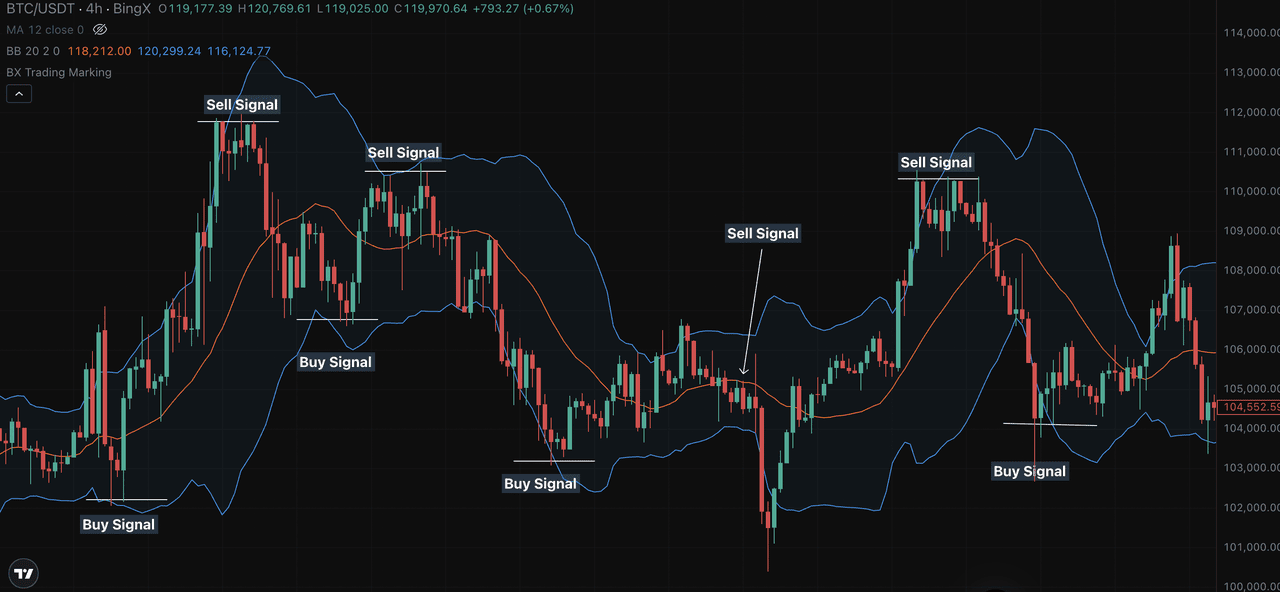
Source: BTC/USDT on BingX spot market
How it works:
• Buy when price touches the lower band
• Sell when price hits the upper band
• Use the 20-period SMA as a trailing stop
• Exit the trade when price returns to the middle band
This method works best in range-bound conditions, where the bands stay relatively flat. For example, if BTC/USDT is trading within a tight range and price taps the lower band, traders may look for short-term buying opportunities.
However, avoid using this approach in strongly trending markets, as price may continue to move beyond the bands, invalidating the bounce setup.
You can apply this strategy directly on BingX charts by combining Bollinger Bands with volume or momentum indicators for confirmation.
How to Spot Trend Breakouts with the Bollinger Band Squeeze
The Bollinger Band Squeeze is a popular way to detect the start of a new trend in the crypto market. It’s based on identifying periods of low volatility followed by sharp price movement.
How to use it:
1. Watch for the bands to tighten, signaling reduced volatility.
2. Wait for a candle to close outside the bands—this marks a potential breakout point.
3. Confirm the move once the bands start to expand, showing momentum is building.
4. Enter a trade in the direction of the breakout:
• Above upper band: consider going long
• Below lower band: consider going short
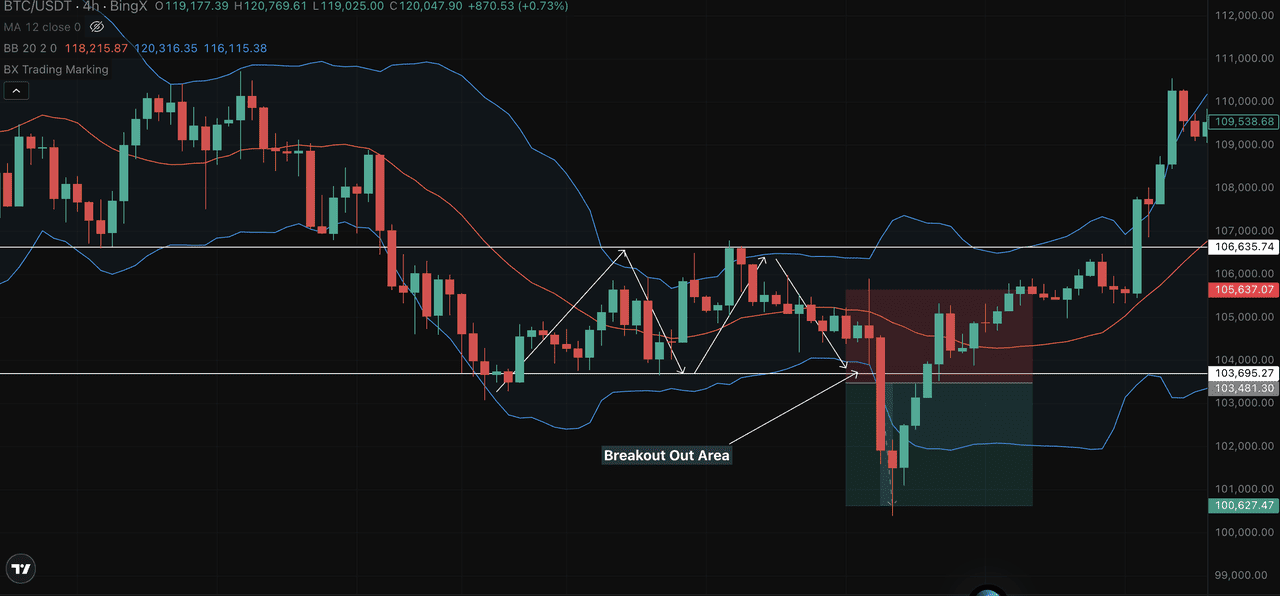
Source: BTC/USDT on BingX spot market
Let’s apply the Bollinger Band Squeeze strategy using this BTC/USDT 4-hour chart from BingX.
In the chart above:
What happened on the chart:
BTC consolidated between $103,695 and $106,635 for several candles. During this time, the Bollinger Bands contracted, showing low volatility. This formed the classic squeeze zone, which often signals that a breakout is near. Eventually, BTC closed below the lower Bollinger Band near $103,695, confirming the bearish breakout.
The move accelerated, and BTC dropped to a low around $100,627, where buyers began to step in. This move from around $103,695 to $100,627 gave a clear downside target of nearly $3,000, following standard breakout logic.
Why this matters for traders:
1. When price closes outside the lower band and bands start to expand, it often signals strong momentum.
2. In this case, traders using BingX Futures could have shorted BTC after the breakout confirmation candle.
3. As a general rule, breakout targets can be set based on the height of the consolidation range, which was roughly $3,000 in this setup.
How to Combine Bollinger Bands with RSI and MACD for Stronger Trade Signals
While Bollinger Bands help visualize volatility and potential breakouts, using them in conjunction with other technical indicators can significantly enhance signal accuracy, especially in cryptocurrency markets.
The chart above shows a BTC/USDT 4-hour setup on BingX, where multiple indicators aligned before a strong downward breakout.
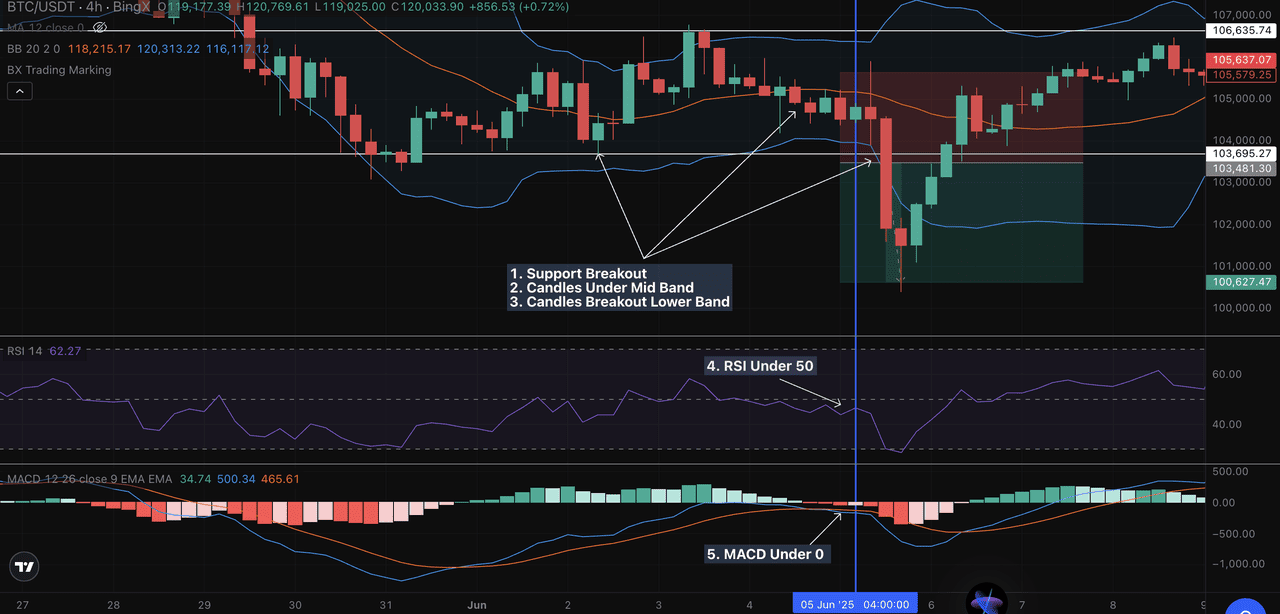
Source: BTC/USDT on BingX spot market
Breakdown of the setup:
1. Support Breakout: Price falls below the $103,695 support level, showing weakness.
2. Candles Below Mid Band: Candles consistently close under the middle Bollinger Band (20 SMA), suggesting bearish bias.
3. Break of Lower Band: Price pushes through the lower band, confirming a volatility breakout.
4. Relative Strength Index (RSI) drops below 50, indicating loss of bullish momentum.
5. Moving Average Convergence Divergence (MACD) crosses below zero, confirming bearish trend acceleration.
With all five conditions aligned, a short position was confirmed near the $103,695–$103,481 zone, with price eventually reaching the $100,627 support target.
Why combine technical indicators?
• Bollinger Bands show volatility shifts
• RSI gauges trend strength or potential overbought/oversold levels
• MACD confirms trend direction and momentum
When all three indicators point in the same direction, traders gain a more confident signal, especially in fast-moving markets like crypto.
Conclusion: Mastering Bollinger Bands on BingX
Bollinger Bands offer crypto traders a reliable way to read market conditions, measure volatility, and identify trade setups with greater precision. Whether you're scalping BTC/USDT in a tight range or looking for breakout opportunities in altcoins, understanding how to use the upper band, lower band, and middle line can improve your timing and risk management.
By combining Bollinger Bands with RSI, MACD, and basic support-resistance levels, traders can filter out noise and focus on higher-quality entries, especially in fast-moving markets like those on BingX.
If you’re serious about developing a consistent crypto trading strategy, Bollinger Bands are a tool worth mastering.
Related Reading
3. Simple Moving Average(SMA) vs Exponential Moving Average(EMA) in Crypto Trading: Differences to Know
FAQs on Bollinger Bands for Trading Crypto
1. What’s the best Bollinger Bands setting for crypto trading?
The default 20-period SMA with 2 standard deviations works well for most crypto pairs. Short-term traders may prefer 10-period with 1.5 deviation for faster signals.
2. Can I use Bollinger Bands for all crypto assets?
Yes, Bollinger Bands work across most BingX trading pairs including BTC/USDT, ETH/USDT, and altcoins. They adapt based on volatility, making them useful even for highly active markets.
3. What does it mean when the bands squeeze?
A Bollinger Band squeeze occurs when volatility drops and the bands tighten. It often precedes a significant price breakout, either upward or downward.
4. Are Bollinger Bands better than RSI or MACD?
They serve different purposes. Bollinger Bands measure volatility, RSI tracks momentum, and MACD confirms trend strength. Using all three together can improve decision-making.
5. Can Bollinger Bands predict the direction of the breakout?
No. They signal that a breakout is likely but not the direction. That’s why confirmation from candles, RSI, MACD, or volume is important before entering a trade.
