In the volatile world of cryptocurrency, prices rarely drop in a straight line. Even in the middle of a brutal bear market, there are moments where the charts turn green, and hope returns to the community. However, for many retail investors, these rallies are a dangerous trap known as a Dead Cat Bounce.
Understanding how to distinguish a "fake-out" from a "breakout" is one of the most vital skills for a crypto trader. A Dead Cat Bounce is a temporary, weak recovery in the price of a declining asset, followed by a continuation of the downtrend.
The term comes from the grim wall-street adage: "Even a dead cat will bounce if it falls from a great height."
What Is a Dead Cat Bounce (DCB) in Crypto Trading?
A Dead Cat Bounce is a specific chart pattern that occurs after a severe price crash. It is characterized by a short-lived recovery rally that lacks the volume and fundamental strength to sustain itself.
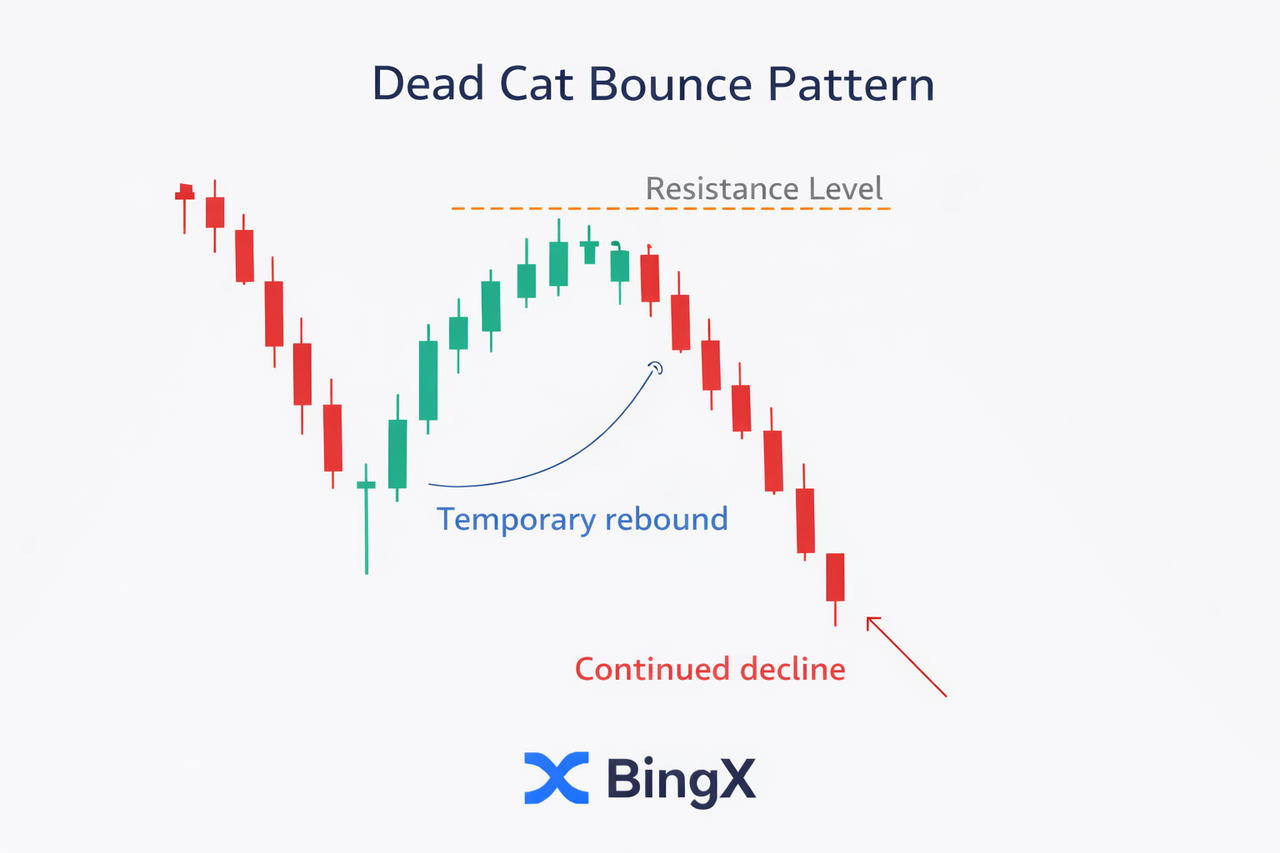
How Does a Dead Cat Bounce Work?
• The Initial Crash: A sharp, often high-volume sell-off occurs.
• The Relief Rally: Prices "bounce" upward. This often looks like a recovery, but it is actually a temporary pause in the selling.
• The Lower High: The rally fails to break past previous major resistance levels.
• The Continuation: The price breaks below the previous low, confirming the "bounce" was a trap.
In crypto, these patterns are common because the market is highly emotional. When Bitcoin or Ethereum drops 20% in a day, traders naturally look for the "bottom," often buying into the first green candle they see without waiting for confirmation.
Why Dead Cat Bounces Happen in Bear Markets
To avoid the trap, you have to understand the mechanics behind the move. A DCB is usually fueled by three things:
• Short Covering: Traders who "shorted" the top must buy back the asset to realize their profits. This influx of buying pressure causes a temporary price hike.
• "Buy the Dip" Sentiment: Emotional retail traders see a lower price and jump in, fearing they will miss out on the recovery.
• Liquidity Grabs: Whales and institutional players may temporarily drive the price up to "hunt" for liquidity before selling even larger positions at a better price.
Dead Cat Bounce vs. True Trend Reversal: Key Differences
Distinguishing between a DCB and a real reversal is what separates profitable traders from those who get "rekt."
| Feature | Dead Cat Bounce | True Trend Reversal |
| Volume | Low or declining during the rally. | High and increasing during the rally. |
| Price Structure | Forms a Lower High. | Forms a Higher High and Higher Low. |
| RSI Level | Often stays below the 50 midline. | Breaks and holds above the 50 midline. |
| News/Fundamentals | No change in negative sentiment. | Positive shift (e.g., ETF approval, lower inflation). |
A dead cat bounce is typically a short-lived rally within a broader downtrend. The rebound often occurs on low or declining volume, forms a lower high on the price chart, and fails to break key resistance levels. Momentum indicators like the RSI (relative strength index) usually remain below the 50 midline, signaling weak buying pressure. Fundamentally, negative sentiment remains unchanged, with no meaningful shift in macro conditions or project-specific developments.
A true trend reversal, on the other hand, shows strong confirmation signals. The rally is supported by high and increasing volume, and price structure shifts to higher highs and higher lows. RSI breaks and holds above the 50 level, reflecting sustained bullish momentum. This move is often backed by positive catalysts, such as ETF approvals, improving economic data like lower inflation, or major ecosystem upgrades.
How to Tell If a Rally Is Just a Dead Cat Bounce: Key Red Flags to Watch
If you’re new to trading, a Dead Cat Bounce (DCB) might look like the start of a big rally. For experienced traders, though, it’s often a "bull trap". Watch for these four key "Red Flags" to spot if a recovery is just a fake-out.
Red Flag 1: Declining Volume or The Ghost Rally
In a real trend reversal, price and volume rise together. As the price goes up, more buyers should join in to support the move.
• The Signal: If the price goes up but trading volume keeps falling, the rally is "hollow."
• Psychology: This means the price is rising because there aren’t many sellers left (short covering), not because new buyers are coming in. When short covering stops, the price often drops since there’s not enough demand.
Red Flag 2: The "Fibonacci Wall" or Mathematical Resistance
A Dead Cat Bounce usually isn’t strong enough to recover past market levels. Instead, it often hits a certain resistance and then stalls.
• The Signal: Pay attention to the 0.382 and 0.5 Fibonacci retracement levels.
• The Behavior: In a DCB, the price often rises right up to these levels before slowing down. If it can’t even reach the "Golden Pocket" (0.618), it’s a strong sign that sellers are still in charge.
Red Flag 3: Bearish Candle Rejections at the Peak
Price action gives the clearest signals. Even if a rally seems strong, certain candles at the top can show that the bounce is ending.
• The Signal: Watch for a Gravestone Doji or a Bearish Engulfing candle at the peak of the relief rally.
• The Interpretation: As we learned, a Gravestone Doji at a peak signifies that buyers tried to push higher but were violently rejected by sellers. Seeing this at a resistance level during a bounce is often the final "nail in the coffin" for the relief rally.
Red Flag 4: RSI Bearish Divergence and Weakness
The Relative Strength Index (RSI) measures the speed and change of price movements. During a DCB, the RSI often reveals the "rot" beneath the surface.
• The Signal: While the price is making a higher peak in the bounce, the RSI may make a lower peak (Bearish Divergence).
• The 50-Midline Trap: Sometimes, the RSI rises but can’t get above the 50 midline. This means that even if the chart shows green candles, the asset’s overall momentum is still bearish.
How to Trade a Dead Cat Bounce: Step-by-Step Guide
It’s not hard to spot a relief rally, but knowing how to handle it takes practice. If you’re just starting out, your main goal is to avoid becoming the “exit liquidity” for more experienced traders. Let’s use the BTC/USDT 4H chart to see how you can spot and trade a possible fake-out.
Step 1: Confirm the Macro Trend
Before you buy, when you see a green candle, take a step back and look at the overall trend. If the price is below the 200 EMA (the red line) on the 4H or Daily chart, the trend is bearish. In this case, treat every rally as a Dead Cat Bounce unless the price makes a Higher High.
BTC/USDT Daily Chart - Source: BingX
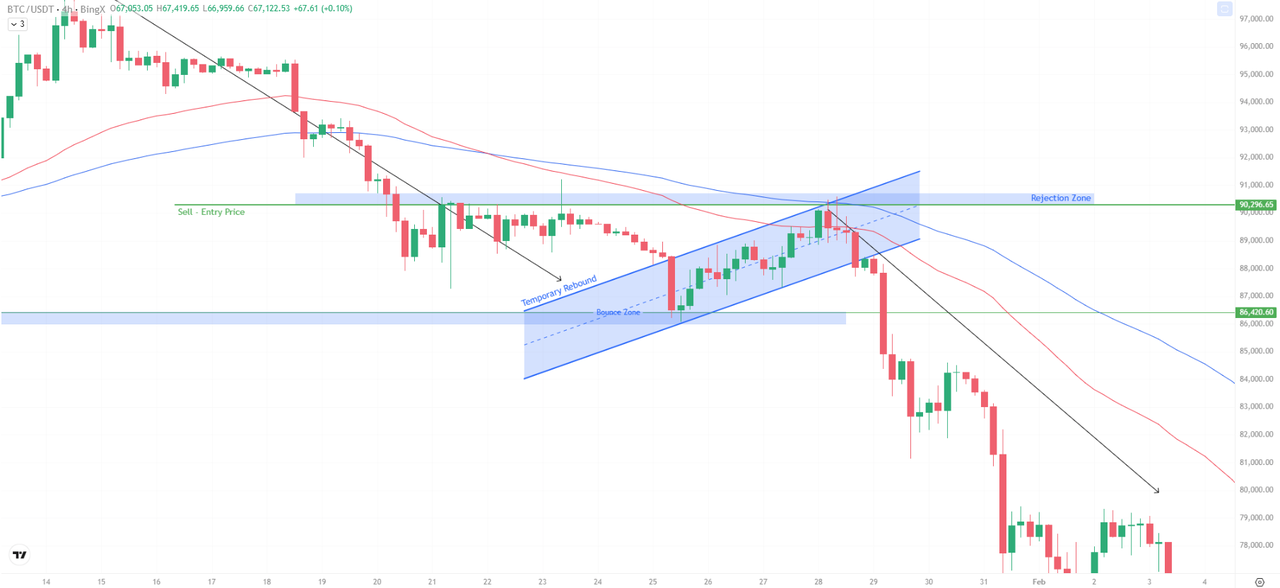
Step 2: Identify the “Bounce Zone” or Resistance
When the price starts to recover after a crash, it usually runs into resistance. Check the chart for old support levels that have turned into resistance. In this example, the price moves up toward the $94,000 to $96,000 area. At this point, stop looking to buy and start watching for signs that the rally is losing strength.
Step 3: Wait for the Rejection
Don’t open a short position just because the price is high. Wait for a clear signal. Look for a bearish reversal candle, like a Gravestone Doji or a Bearish Engulfing candle, right at the resistance zone. In the example, you can see long upper wicks near $98,000. These show that sellers are pushing the price down.
Step 4: Entry Logic or The Sell
A safer way to enter a short trade is to wait until the price drops below the low of the rejection candle or falls out of the Ascending Channel (the blue lines).
Entry Figure: On this chart, a good entry point is around $92,275, which is marked by the blue “Sell” line. Enter when the price clearly loses its upward momentum.
BTC/USDT Daily Chart - Source: BingX
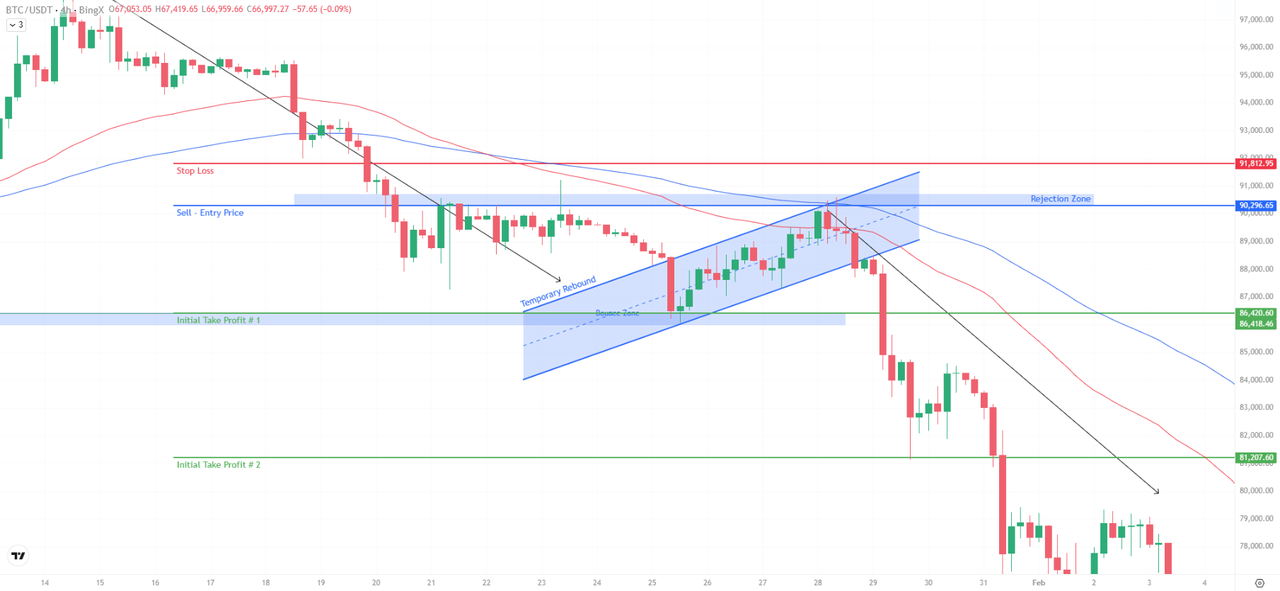
Step 5: Precise Stop-Loss Placement
Protect yourself in case the price starts rising again. Set your Stop Loss (SL) just above the highest point of the bounce. In this setup, the SL is at $124,500 (the red line), which is where your bearish idea would be proven wrong.
Step 6: Take-Profit (Exit) Logic
Don’t stay in the trade too long. Target the area where the first crash ended or other strong support levels. The first Take Profit is marked on the green line, around $118,500. This helps you secure most of the gains before another bounce might happen.
Common Mistakes Traders Make During a Dead Cat Bounce
The Dead Cat Bounce is a risky bull trap that happens because of both emotional reactions and technical factors. When prices fall sharply, the first rally usually comes from short sellers buying back assets to secure profits, along with retail traders trying to buy the dip.
But this recovery is weak. It mostly allows large investors to use the brief price increase to sell off bigger positions at better prices.
Many traders make mistakes by jumping in at the first sign of a price increase without checking if the market structure supports it. If there is no higher high and strong volume, the bounce is likely just a temporary move at key resistance levels, not a real trend change.
To avoid losses, focus on market structure instead of emotions, and wait for the price to move above the 200 EMA before deciding the bottom is in.
Conclusion: Prioritize Structure Over Emotion
The Dead Cat Bounce is a powerful reminder that in the crypto markets, market structure always trumps emotional reactions. A few green candles on a screen do not signal the end of a bear market; they are often the "lure" used to trap over-eager traders.
To survive these high-risk environments, you must remain disciplined: focus on declining volume as a red flag, wait for the price to break major resistance levels like the 200 EMA, and always look for bearish rejection candles at Fibonacci levels before assuming a trend has changed.
By keeping a cool head during relief rallies and relying on technical confirmation rather than "FOMO," you can transform a dangerous bull trap into a strategic shorting opportunity. Don't get trapped by the next fake-out. Sign up for BingX and use our advanced charting tools to spot the difference between a bounce and a breakout.
Related Reading
2. What Is Dark Cloud Cover Pattern in Crypto Trading and How to Spot Early Market Shifts in Crypto?
5. Morning Star vs. Evening Star Patterns: How to Trade Bullish & Bearish Reversals in Crypto Market
FAQs on Dead Cat Bounce in the Crypto Market
1. How long does a Dead Cat Bounce last?
It can last from a few days to several weeks, depending on the timeframe. On a 4H chart, it might last 24–48 hours; on a Daily chart, it could last two weeks.
2. Can a Dead Cat Bounce turn into a real reversal?
Yes, but it requires a fundamental shift and a "Higher High" breakout on high volume. Until the price breaks the previous major swing high, it is safer to treat it as a DCB.
3. Is the RSI useful for spotting a DCB?
Absolutely. If the price rallies but the RSI creates a "Lower High" (Bearish Divergence), it is a strong signal that the bounce is a fake-out.
4. What is the best timeframe to spot a DCB?
The 4H and Daily timeframes are the most reliable. Lower timeframes like the 5-minute chart have too much noise to accurately identify a macro DCB.
5. Why is it called a "Dead Cat" bounce?
It’s a traditional trading term used to describe the fact that even a declining, "dead" asset will experience a small bounce due to technical factors before continuing its fall.